Mexican vs Trinidadian and Tobagonian 10th Grade
COMPARE
Mexican
Trinidadian and Tobagonian
10th Grade
10th Grade Comparison
Mexicans
Trinidadians and Tobagonians
87.8%
10TH GRADE
0.0/ 100
METRIC RATING
340th/ 347
METRIC RANK
92.4%
10TH GRADE
0.2/ 100
METRIC RATING
273rd/ 347
METRIC RANK
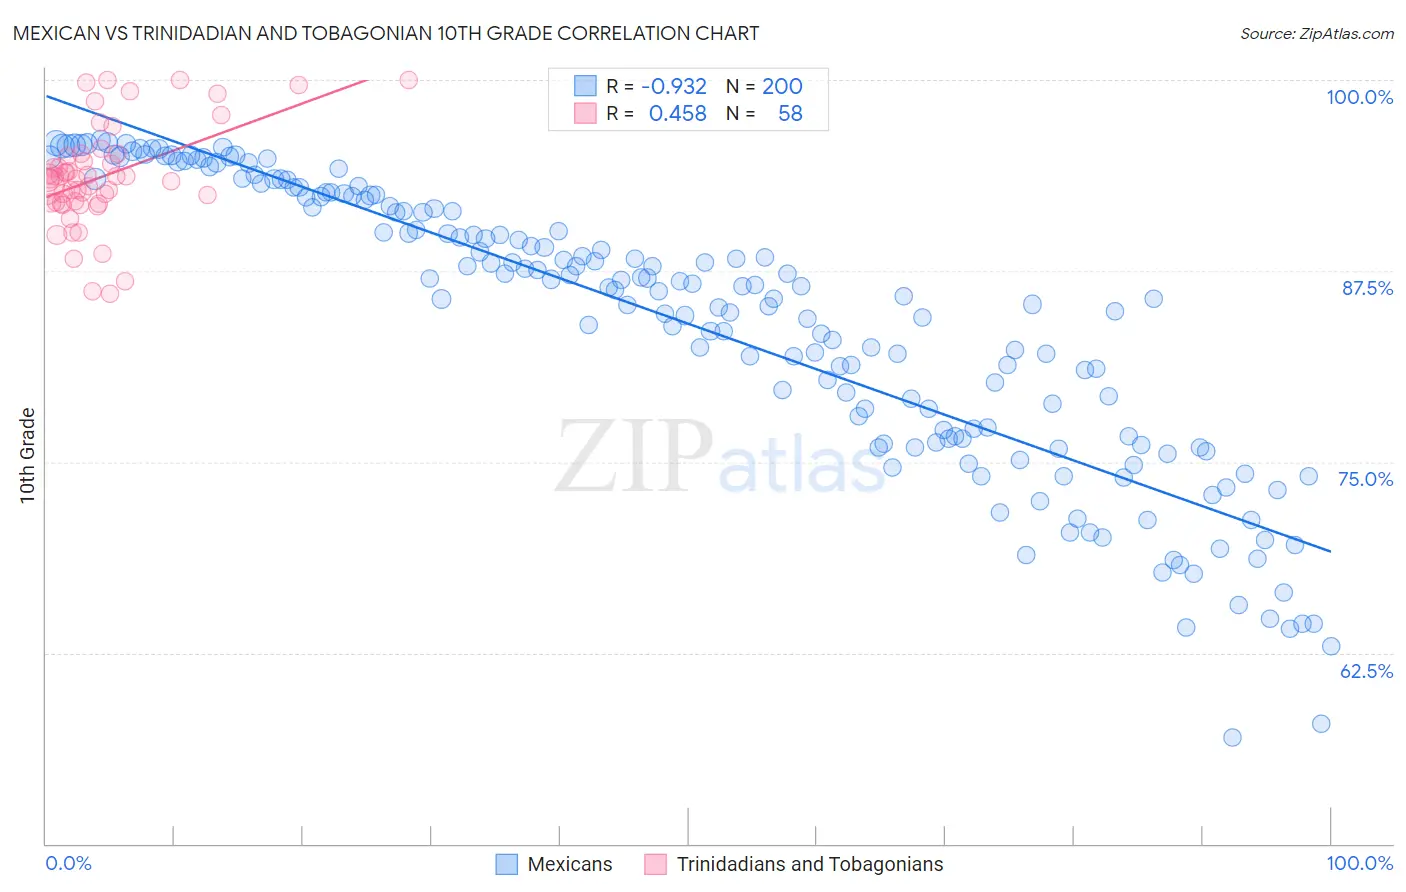
Mexican vs Trinidadian and Tobagonian 10th Grade Correlation Chart
The statistical analysis conducted on geographies consisting of 565,338,990 people shows a near-perfect negative correlation between the proportion of Mexicans and percentage of population with at least 10th grade education in the United States with a correlation coefficient (R) of -0.932 and weighted average of 87.8%. Similarly, the statistical analysis conducted on geographies consisting of 219,881,170 people shows a moderate positive correlation between the proportion of Trinidadians and Tobagonians and percentage of population with at least 10th grade education in the United States with a correlation coefficient (R) of 0.458 and weighted average of 92.4%, a difference of 5.3%.
10th Grade Correlation Summary
| Measurement | Mexican | Trinidadian and Tobagonian |
| Minimum | 57.0% | 86.0% |
| Maximum | 96.1% | 100.0% |
| Range | 39.1% | 14.0% |
| Mean | 84.0% | 93.7% |
| Median | 86.3% | 93.5% |
| Interquartile 25% (IQ1) | 76.6% | 92.0% |
| Interquartile 75% (IQ3) | 92.3% | 95.0% |
| Interquartile Range (IQR) | 15.7% | 3.1% |
| Standard Deviation (Sample) | 9.3% | 3.3% |
| Standard Deviation (Population) | 9.2% | 3.3% |
Similar Demographics by 10th Grade
Demographics Similar to Mexicans by 10th Grade
In terms of 10th grade, the demographic groups most similar to Mexicans are Guatemalan (87.9%, a difference of 0.16%), Salvadoran (87.5%, a difference of 0.29%), Immigrants from Guatemala (87.4%, a difference of 0.44%), Immigrants from Latin America (88.3%, a difference of 0.65%), and Central American (88.4%, a difference of 0.71%).
| Demographics | Rating | Rank | 10th Grade |
| Hondurans | 0.0 /100 | #333 | Tragic 89.0% |
| Hispanics or Latinos | 0.0 /100 | #334 | Tragic 88.9% |
| Immigrants | Dominican Republic | 0.0 /100 | #335 | Tragic 88.7% |
| Immigrants | Honduras | 0.0 /100 | #336 | Tragic 88.5% |
| Central Americans | 0.0 /100 | #337 | Tragic 88.4% |
| Immigrants | Latin America | 0.0 /100 | #338 | Tragic 88.3% |
| Guatemalans | 0.0 /100 | #339 | Tragic 87.9% |
| Mexicans | 0.0 /100 | #340 | Tragic 87.8% |
| Salvadorans | 0.0 /100 | #341 | Tragic 87.5% |
| Immigrants | Guatemala | 0.0 /100 | #342 | Tragic 87.4% |
| Yakama | 0.0 /100 | #343 | Tragic 86.9% |
| Immigrants | El Salvador | 0.0 /100 | #344 | Tragic 86.8% |
| Immigrants | Central America | 0.0 /100 | #345 | Tragic 86.6% |
| Spanish American Indians | 0.0 /100 | #346 | Tragic 86.2% |
| Immigrants | Mexico | 0.0 /100 | #347 | Tragic 86.2% |
Demographics Similar to Trinidadians and Tobagonians by 10th Grade
In terms of 10th grade, the demographic groups most similar to Trinidadians and Tobagonians are Immigrants from Congo (92.4%, a difference of 0.010%), West Indian (92.4%, a difference of 0.010%), Immigrants from Western Africa (92.5%, a difference of 0.070%), Immigrants from Eritrea (92.5%, a difference of 0.080%), and Immigrants from Colombia (92.5%, a difference of 0.090%).
| Demographics | Rating | Rank | 10th Grade |
| Immigrants | Philippines | 0.4 /100 | #266 | Tragic 92.6% |
| Taiwanese | 0.3 /100 | #267 | Tragic 92.5% |
| Immigrants | Ghana | 0.3 /100 | #268 | Tragic 92.5% |
| Immigrants | Colombia | 0.3 /100 | #269 | Tragic 92.5% |
| Immigrants | Uruguay | 0.3 /100 | #270 | Tragic 92.5% |
| Immigrants | Eritrea | 0.3 /100 | #271 | Tragic 92.5% |
| Immigrants | Western Africa | 0.3 /100 | #272 | Tragic 92.5% |
| Trinidadians and Tobagonians | 0.2 /100 | #273 | Tragic 92.4% |
| Immigrants | Congo | 0.2 /100 | #274 | Tragic 92.4% |
| West Indians | 0.2 /100 | #275 | Tragic 92.4% |
| Immigrants | Trinidad and Tobago | 0.1 /100 | #276 | Tragic 92.3% |
| Navajo | 0.1 /100 | #277 | Tragic 92.3% |
| Barbadians | 0.1 /100 | #278 | Tragic 92.2% |
| Natives/Alaskans | 0.1 /100 | #279 | Tragic 92.2% |
| Malaysians | 0.1 /100 | #280 | Tragic 92.2% |