Mexican vs Trinidadian and Tobagonian Associate's Degree
COMPARE
Mexican
Trinidadian and Tobagonian
Associate's Degree
Associate's Degree Comparison
Mexicans
Trinidadians and Tobagonians
35.0%
ASSOCIATE'S DEGREE
0.0/ 100
METRIC RATING
333rd/ 347
METRIC RANK
43.6%
ASSOCIATE'S DEGREE
4.0/ 100
METRIC RATING
227th/ 347
METRIC RANK
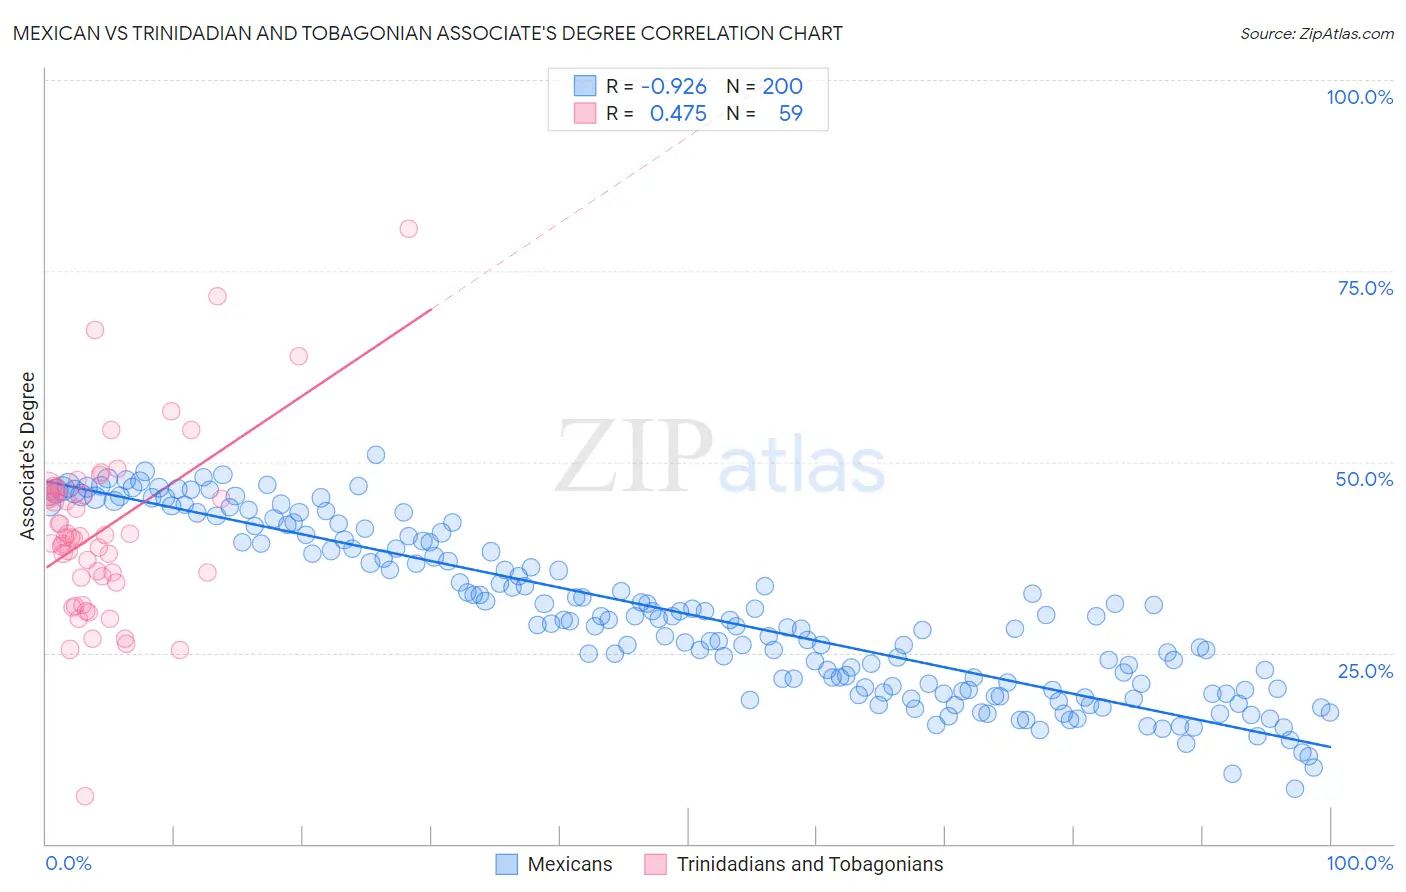
Mexican vs Trinidadian and Tobagonian Associate's Degree Correlation Chart
The statistical analysis conducted on geographies consisting of 565,203,819 people shows a near-perfect negative correlation between the proportion of Mexicans and percentage of population with at least associate's degree education in the United States with a correlation coefficient (R) of -0.926 and weighted average of 35.0%. Similarly, the statistical analysis conducted on geographies consisting of 219,861,537 people shows a moderate positive correlation between the proportion of Trinidadians and Tobagonians and percentage of population with at least associate's degree education in the United States with a correlation coefficient (R) of 0.475 and weighted average of 43.6%, a difference of 24.6%.
Associate's Degree Correlation Summary
| Measurement | Mexican | Trinidadian and Tobagonian |
| Minimum | 7.3% | 6.2% |
| Maximum | 50.9% | 80.5% |
| Range | 43.6% | 74.4% |
| Mean | 30.0% | 41.1% |
| Median | 29.3% | 40.2% |
| Interquartile 25% (IQ1) | 20.2% | 34.9% |
| Interquartile 75% (IQ3) | 39.7% | 46.3% |
| Interquartile Range (IQR) | 19.5% | 11.4% |
| Standard Deviation (Sample) | 10.9% | 11.9% |
| Standard Deviation (Population) | 10.9% | 11.8% |
Similar Demographics by Associate's Degree
Demographics Similar to Mexicans by Associate's Degree
In terms of associate's degree, the demographic groups most similar to Mexicans are Immigrants from Central America (35.0%, a difference of 0.080%), Native/Alaskan (34.9%, a difference of 0.24%), Spanish American Indian (34.9%, a difference of 0.37%), Hopi (34.6%, a difference of 1.3%), and Immigrants from the Azores (35.6%, a difference of 1.9%).
| Demographics | Rating | Rank | Associate's Degree |
| Kiowa | 0.0 /100 | #326 | Tragic 36.5% |
| Dutch West Indians | 0.0 /100 | #327 | Tragic 36.5% |
| Alaskan Athabascans | 0.0 /100 | #328 | Tragic 36.5% |
| Paiute | 0.0 /100 | #329 | Tragic 36.4% |
| Apache | 0.0 /100 | #330 | Tragic 36.2% |
| Immigrants | Azores | 0.0 /100 | #331 | Tragic 35.6% |
| Immigrants | Central America | 0.0 /100 | #332 | Tragic 35.0% |
| Mexicans | 0.0 /100 | #333 | Tragic 35.0% |
| Natives/Alaskans | 0.0 /100 | #334 | Tragic 34.9% |
| Spanish American Indians | 0.0 /100 | #335 | Tragic 34.9% |
| Hopi | 0.0 /100 | #336 | Tragic 34.6% |
| Lumbee | 0.0 /100 | #337 | Tragic 34.1% |
| Pueblo | 0.0 /100 | #338 | Tragic 34.0% |
| Immigrants | Mexico | 0.0 /100 | #339 | Tragic 33.7% |
| Navajo | 0.0 /100 | #340 | Tragic 32.6% |
Demographics Similar to Trinidadians and Tobagonians by Associate's Degree
In terms of associate's degree, the demographic groups most similar to Trinidadians and Tobagonians are Immigrants from Burma/Myanmar (43.7%, a difference of 0.17%), Guamanian/Chamorro (43.8%, a difference of 0.39%), Hmong (43.4%, a difference of 0.44%), West Indian (43.8%, a difference of 0.54%), and Immigrants from Trinidad and Tobago (43.3%, a difference of 0.60%).
| Demographics | Rating | Rank | Associate's Degree |
| Portuguese | 7.2 /100 | #220 | Tragic 44.1% |
| Immigrants | Western Africa | 6.6 /100 | #221 | Tragic 44.1% |
| Barbadians | 5.8 /100 | #222 | Tragic 43.9% |
| Sub-Saharan Africans | 5.5 /100 | #223 | Tragic 43.9% |
| West Indians | 5.2 /100 | #224 | Tragic 43.8% |
| Guamanians/Chamorros | 4.8 /100 | #225 | Tragic 43.8% |
| Immigrants | Burma/Myanmar | 4.3 /100 | #226 | Tragic 43.7% |
| Trinidadians and Tobagonians | 4.0 /100 | #227 | Tragic 43.6% |
| Hmong | 3.2 /100 | #228 | Tragic 43.4% |
| Immigrants | Trinidad and Tobago | 3.0 /100 | #229 | Tragic 43.3% |
| Immigrants | Barbados | 2.9 /100 | #230 | Tragic 43.3% |
| Liberians | 2.9 /100 | #231 | Tragic 43.3% |
| Native Hawaiians | 2.3 /100 | #232 | Tragic 43.1% |
| Tongans | 2.2 /100 | #233 | Tragic 43.0% |
| Tlingit-Haida | 2.1 /100 | #234 | Tragic 43.0% |