Mexican vs Immigrants from Fiji Single Father Poverty
COMPARE
Mexican
Immigrants from Fiji
Single Father Poverty
Single Father Poverty Comparison
Mexicans
Immigrants from Fiji
16.1%
SINGLE FATHER POVERTY
70.1/ 100
METRIC RATING
154th/ 347
METRIC RANK
13.2%
SINGLE FATHER POVERTY
100.0/ 100
METRIC RATING
4th/ 347
METRIC RANK
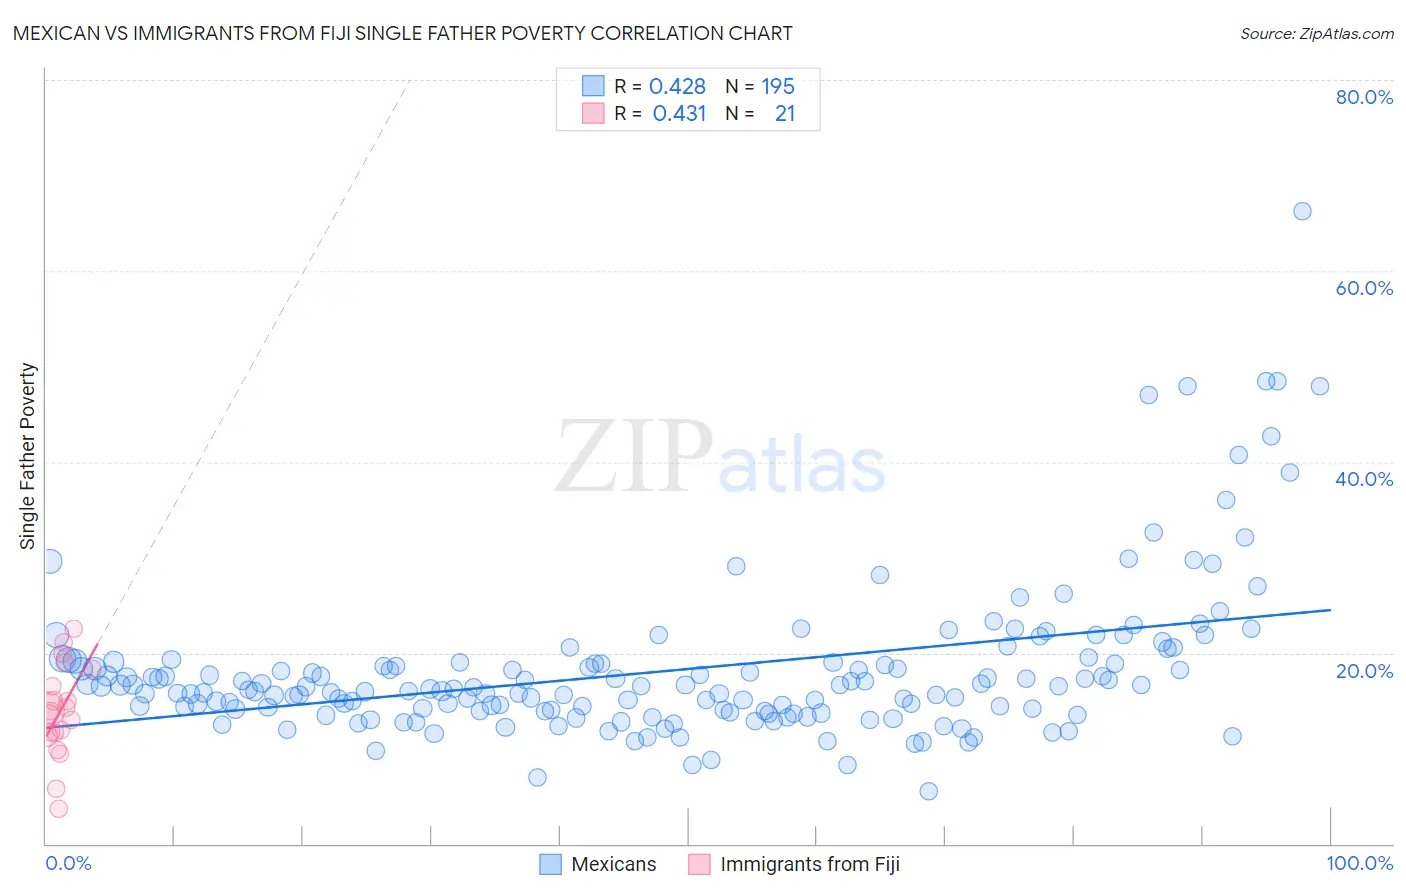
Mexican vs Immigrants from Fiji Single Father Poverty Correlation Chart
The statistical analysis conducted on geographies consisting of 409,525,490 people shows a moderate positive correlation between the proportion of Mexicans and poverty level among single fathers in the United States with a correlation coefficient (R) of 0.428 and weighted average of 16.1%. Similarly, the statistical analysis conducted on geographies consisting of 85,969,889 people shows a moderate positive correlation between the proportion of Immigrants from Fiji and poverty level among single fathers in the United States with a correlation coefficient (R) of 0.431 and weighted average of 13.2%, a difference of 22.0%.
Single Father Poverty Correlation Summary
| Measurement | Mexican | Immigrants from Fiji |
| Minimum | 5.5% | 3.7% |
| Maximum | 66.2% | 22.5% |
| Range | 60.7% | 18.8% |
| Mean | 18.2% | 13.9% |
| Median | 16.2% | 13.9% |
| Interquartile 25% (IQ1) | 13.9% | 11.4% |
| Interquartile 75% (IQ3) | 19.0% | 17.4% |
| Interquartile Range (IQR) | 5.1% | 6.0% |
| Standard Deviation (Sample) | 8.2% | 4.7% |
| Standard Deviation (Population) | 8.1% | 4.6% |
Similar Demographics by Single Father Poverty
Demographics Similar to Mexicans by Single Father Poverty
In terms of single father poverty, the demographic groups most similar to Mexicans are Immigrants from Zimbabwe (16.1%, a difference of 0.10%), Immigrants from Israel (16.1%, a difference of 0.10%), Immigrants from Nicaragua (16.2%, a difference of 0.12%), Immigrants from France (16.1%, a difference of 0.16%), and Immigrants from Jordan (16.2%, a difference of 0.21%).
| Demographics | Rating | Rank | Single Father Poverty |
| Colombians | 77.1 /100 | #147 | Good 16.1% |
| Nigerians | 76.8 /100 | #148 | Good 16.1% |
| South Africans | 75.1 /100 | #149 | Good 16.1% |
| Jordanians | 74.2 /100 | #150 | Good 16.1% |
| Immigrants | France | 73.1 /100 | #151 | Good 16.1% |
| Immigrants | Zimbabwe | 72.1 /100 | #152 | Good 16.1% |
| Immigrants | Israel | 72.0 /100 | #153 | Good 16.1% |
| Mexicans | 70.1 /100 | #154 | Good 16.1% |
| Immigrants | Nicaragua | 67.8 /100 | #155 | Good 16.2% |
| Immigrants | Jordan | 66.0 /100 | #156 | Good 16.2% |
| Immigrants | Czechoslovakia | 62.8 /100 | #157 | Good 16.2% |
| Portuguese | 62.3 /100 | #158 | Good 16.2% |
| Belizeans | 59.9 /100 | #159 | Average 16.2% |
| Immigrants | Sudan | 59.8 /100 | #160 | Average 16.2% |
| Estonians | 56.7 /100 | #161 | Average 16.2% |
Demographics Similar to Immigrants from Fiji by Single Father Poverty
In terms of single father poverty, the demographic groups most similar to Immigrants from Fiji are Immigrants from Ethiopia (13.4%, a difference of 1.6%), Ethiopian (13.5%, a difference of 2.3%), Immigrants from Taiwan (13.7%, a difference of 3.4%), Tsimshian (12.7%, a difference of 4.2%), and Samoan (13.8%, a difference of 4.3%).
| Demographics | Rating | Rank | Single Father Poverty |
| Assyrians/Chaldeans/Syriacs | 100.0 /100 | #1 | Exceptional 11.7% |
| Tongans | 100.0 /100 | #2 | Exceptional 12.2% |
| Tsimshian | 100.0 /100 | #3 | Exceptional 12.7% |
| Immigrants | Fiji | 100.0 /100 | #4 | Exceptional 13.2% |
| Immigrants | Ethiopia | 100.0 /100 | #5 | Exceptional 13.4% |
| Ethiopians | 100.0 /100 | #6 | Exceptional 13.5% |
| Immigrants | Taiwan | 100.0 /100 | #7 | Exceptional 13.7% |
| Samoans | 100.0 /100 | #8 | Exceptional 13.8% |
| Afghans | 100.0 /100 | #9 | Exceptional 14.0% |
| Koreans | 100.0 /100 | #10 | Exceptional 14.0% |
| Filipinos | 100.0 /100 | #11 | Exceptional 14.0% |
| Immigrants | India | 100.0 /100 | #12 | Exceptional 14.0% |
| Immigrants | Philippines | 100.0 /100 | #13 | Exceptional 14.0% |
| Immigrants | Vietnam | 100.0 /100 | #14 | Exceptional 14.1% |
| Sri Lankans | 100.0 /100 | #15 | Exceptional 14.2% |