Immigrants from Iran vs Trinidadian and Tobagonian Single Father Poverty
COMPARE
Immigrants from Iran
Trinidadian and Tobagonian
Single Father Poverty
Single Father Poverty Comparison
Immigrants from Iran
Trinidadians and Tobagonians
14.2%
SINGLE FATHER POVERTY
100.0/ 100
METRIC RATING
16th/ 347
METRIC RANK
17.0%
SINGLE FATHER POVERTY
1.5/ 100
METRIC RATING
245th/ 347
METRIC RANK
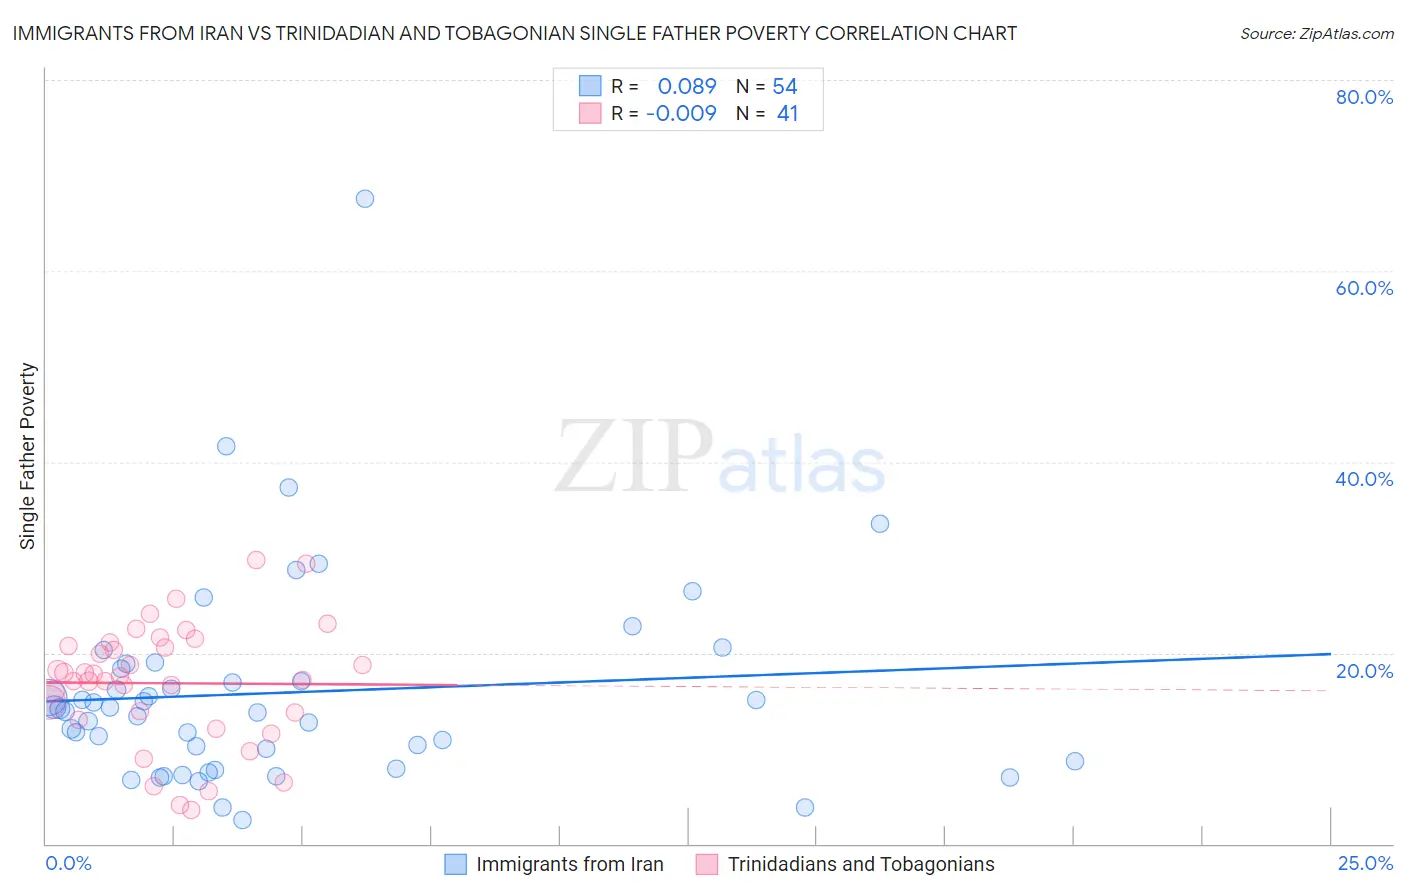
Immigrants from Iran vs Trinidadian and Tobagonian Single Father Poverty Correlation Chart
The statistical analysis conducted on geographies consisting of 227,784,696 people shows a slight positive correlation between the proportion of Immigrants from Iran and poverty level among single fathers in the United States with a correlation coefficient (R) of 0.089 and weighted average of 14.2%. Similarly, the statistical analysis conducted on geographies consisting of 188,831,779 people shows no correlation between the proportion of Trinidadians and Tobagonians and poverty level among single fathers in the United States with a correlation coefficient (R) of -0.009 and weighted average of 17.0%, a difference of 20.2%.
Single Father Poverty Correlation Summary
| Measurement | Immigrants from Iran | Trinidadian and Tobagonian |
| Minimum | 2.4% | 3.5% |
| Maximum | 67.6% | 29.7% |
| Range | 65.1% | 26.2% |
| Mean | 15.8% | 16.8% |
| Median | 14.0% | 17.5% |
| Interquartile 25% (IQ1) | 8.7% | 13.4% |
| Interquartile 75% (IQ3) | 18.3% | 20.9% |
| Interquartile Range (IQR) | 9.6% | 7.6% |
| Standard Deviation (Sample) | 10.9% | 6.3% |
| Standard Deviation (Population) | 10.8% | 6.2% |
Similar Demographics by Single Father Poverty
Demographics Similar to Immigrants from Iran by Single Father Poverty
In terms of single father poverty, the demographic groups most similar to Immigrants from Iran are Sri Lankan (14.2%, a difference of 0.20%), Immigrants from Vietnam (14.1%, a difference of 0.26%), Immigrants from Hong Kong (14.2%, a difference of 0.45%), Soviet Union (14.3%, a difference of 0.48%), and Immigrants from Iraq (14.3%, a difference of 0.52%).
| Demographics | Rating | Rank | Single Father Poverty |
| Afghans | 100.0 /100 | #9 | Exceptional 14.0% |
| Koreans | 100.0 /100 | #10 | Exceptional 14.0% |
| Filipinos | 100.0 /100 | #11 | Exceptional 14.0% |
| Immigrants | India | 100.0 /100 | #12 | Exceptional 14.0% |
| Immigrants | Philippines | 100.0 /100 | #13 | Exceptional 14.0% |
| Immigrants | Vietnam | 100.0 /100 | #14 | Exceptional 14.1% |
| Sri Lankans | 100.0 /100 | #15 | Exceptional 14.2% |
| Immigrants | Iran | 100.0 /100 | #16 | Exceptional 14.2% |
| Immigrants | Hong Kong | 100.0 /100 | #17 | Exceptional 14.2% |
| Soviet Union | 100.0 /100 | #18 | Exceptional 14.3% |
| Immigrants | Iraq | 100.0 /100 | #19 | Exceptional 14.3% |
| Immigrants | Singapore | 100.0 /100 | #20 | Exceptional 14.3% |
| Immigrants | Afghanistan | 100.0 /100 | #21 | Exceptional 14.3% |
| Taiwanese | 100.0 /100 | #22 | Exceptional 14.3% |
| Immigrants | Egypt | 100.0 /100 | #23 | Exceptional 14.4% |
Demographics Similar to Trinidadians and Tobagonians by Single Father Poverty
In terms of single father poverty, the demographic groups most similar to Trinidadians and Tobagonians are Honduran (17.0%, a difference of 0.040%), Immigrants from Ireland (17.1%, a difference of 0.040%), Immigrants from Cabo Verde (17.0%, a difference of 0.060%), Greek (17.1%, a difference of 0.14%), and Czechoslovakian (17.1%, a difference of 0.14%).
| Demographics | Rating | Rank | Single Father Poverty |
| Immigrants | Saudi Arabia | 2.7 /100 | #238 | Tragic 16.9% |
| Bermudans | 2.6 /100 | #239 | Tragic 16.9% |
| Finns | 2.6 /100 | #240 | Tragic 16.9% |
| Czechs | 2.3 /100 | #241 | Tragic 17.0% |
| Moroccans | 2.1 /100 | #242 | Tragic 17.0% |
| Immigrants | Cabo Verde | 1.6 /100 | #243 | Tragic 17.0% |
| Hondurans | 1.6 /100 | #244 | Tragic 17.0% |
| Trinidadians and Tobagonians | 1.5 /100 | #245 | Tragic 17.0% |
| Immigrants | Ireland | 1.4 /100 | #246 | Tragic 17.1% |
| Greeks | 1.3 /100 | #247 | Tragic 17.1% |
| Czechoslovakians | 1.3 /100 | #248 | Tragic 17.1% |
| Canadians | 1.3 /100 | #249 | Tragic 17.1% |
| Austrians | 1.1 /100 | #250 | Tragic 17.1% |
| Luxembourgers | 1.1 /100 | #251 | Tragic 17.1% |
| Croatians | 1.0 /100 | #252 | Tragic 17.1% |