Mexican vs Immigrants from Turkey Single Father Poverty
COMPARE
Mexican
Immigrants from Turkey
Single Father Poverty
Single Father Poverty Comparison
Mexicans
Immigrants from Turkey
16.1%
SINGLE FATHER POVERTY
70.1/ 100
METRIC RATING
154th/ 347
METRIC RANK
15.3%
SINGLE FATHER POVERTY
99.5/ 100
METRIC RATING
75th/ 347
METRIC RANK
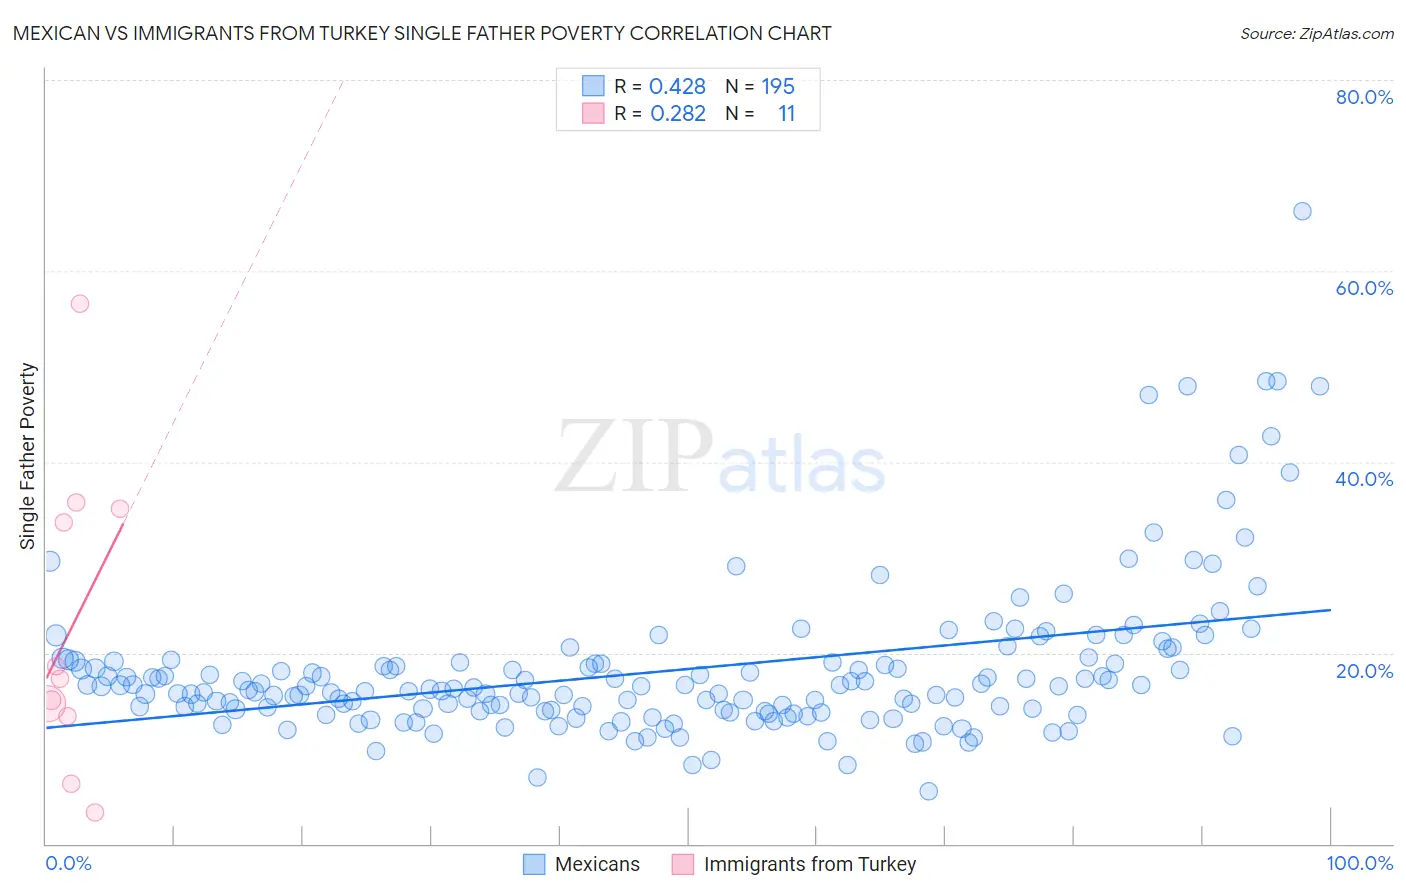
Mexican vs Immigrants from Turkey Single Father Poverty Correlation Chart
The statistical analysis conducted on geographies consisting of 409,525,490 people shows a moderate positive correlation between the proportion of Mexicans and poverty level among single fathers in the United States with a correlation coefficient (R) of 0.428 and weighted average of 16.1%. Similarly, the statistical analysis conducted on geographies consisting of 182,600,036 people shows a weak positive correlation between the proportion of Immigrants from Turkey and poverty level among single fathers in the United States with a correlation coefficient (R) of 0.282 and weighted average of 15.3%, a difference of 5.3%.
Single Father Poverty Correlation Summary
| Measurement | Mexican | Immigrants from Turkey |
| Minimum | 5.5% | 3.3% |
| Maximum | 66.2% | 56.5% |
| Range | 60.7% | 53.2% |
| Mean | 18.2% | 22.7% |
| Median | 16.2% | 17.3% |
| Interquartile 25% (IQ1) | 13.9% | 13.3% |
| Interquartile 75% (IQ3) | 19.0% | 35.1% |
| Interquartile Range (IQR) | 5.1% | 21.8% |
| Standard Deviation (Sample) | 8.2% | 15.8% |
| Standard Deviation (Population) | 8.1% | 15.1% |
Similar Demographics by Single Father Poverty
Demographics Similar to Mexicans by Single Father Poverty
In terms of single father poverty, the demographic groups most similar to Mexicans are Immigrants from Zimbabwe (16.1%, a difference of 0.10%), Immigrants from Israel (16.1%, a difference of 0.10%), Immigrants from Nicaragua (16.2%, a difference of 0.12%), Immigrants from France (16.1%, a difference of 0.16%), and Immigrants from Jordan (16.2%, a difference of 0.21%).
| Demographics | Rating | Rank | Single Father Poverty |
| Colombians | 77.1 /100 | #147 | Good 16.1% |
| Nigerians | 76.8 /100 | #148 | Good 16.1% |
| South Africans | 75.1 /100 | #149 | Good 16.1% |
| Jordanians | 74.2 /100 | #150 | Good 16.1% |
| Immigrants | France | 73.1 /100 | #151 | Good 16.1% |
| Immigrants | Zimbabwe | 72.1 /100 | #152 | Good 16.1% |
| Immigrants | Israel | 72.0 /100 | #153 | Good 16.1% |
| Mexicans | 70.1 /100 | #154 | Good 16.1% |
| Immigrants | Nicaragua | 67.8 /100 | #155 | Good 16.2% |
| Immigrants | Jordan | 66.0 /100 | #156 | Good 16.2% |
| Immigrants | Czechoslovakia | 62.8 /100 | #157 | Good 16.2% |
| Portuguese | 62.3 /100 | #158 | Good 16.2% |
| Belizeans | 59.9 /100 | #159 | Average 16.2% |
| Immigrants | Sudan | 59.8 /100 | #160 | Average 16.2% |
| Estonians | 56.7 /100 | #161 | Average 16.2% |
Demographics Similar to Immigrants from Turkey by Single Father Poverty
In terms of single father poverty, the demographic groups most similar to Immigrants from Turkey are Maltese (15.3%, a difference of 0.020%), Kenyan (15.3%, a difference of 0.060%), Immigrants from Japan (15.3%, a difference of 0.080%), Immigrants from Peru (15.3%, a difference of 0.090%), and Tlingit-Haida (15.3%, a difference of 0.14%).
| Demographics | Rating | Rank | Single Father Poverty |
| Immigrants | Cameroon | 99.7 /100 | #68 | Exceptional 15.2% |
| Japanese | 99.7 /100 | #69 | Exceptional 15.2% |
| Mongolians | 99.7 /100 | #70 | Exceptional 15.3% |
| Immigrants | Brazil | 99.6 /100 | #71 | Exceptional 15.3% |
| Immigrants | Lithuania | 99.6 /100 | #72 | Exceptional 15.3% |
| Kenyans | 99.6 /100 | #73 | Exceptional 15.3% |
| Maltese | 99.6 /100 | #74 | Exceptional 15.3% |
| Immigrants | Turkey | 99.5 /100 | #75 | Exceptional 15.3% |
| Immigrants | Japan | 99.5 /100 | #76 | Exceptional 15.3% |
| Immigrants | Peru | 99.5 /100 | #77 | Exceptional 15.3% |
| Tlingit-Haida | 99.5 /100 | #78 | Exceptional 15.3% |
| Immigrants | Northern Africa | 99.5 /100 | #79 | Exceptional 15.3% |
| Armenians | 99.4 /100 | #80 | Exceptional 15.4% |
| Immigrants | Congo | 99.4 /100 | #81 | Exceptional 15.4% |
| Immigrants | Ukraine | 99.4 /100 | #82 | Exceptional 15.4% |