Immigrants from Portugal vs Trinidadian and Tobagonian Single Father Poverty
COMPARE
Immigrants from Portugal
Trinidadian and Tobagonian
Single Father Poverty
Single Father Poverty Comparison
Immigrants from Portugal
Trinidadians and Tobagonians
15.9%
SINGLE FATHER POVERTY
89.7/ 100
METRIC RATING
132nd/ 347
METRIC RANK
17.0%
SINGLE FATHER POVERTY
1.5/ 100
METRIC RATING
245th/ 347
METRIC RANK
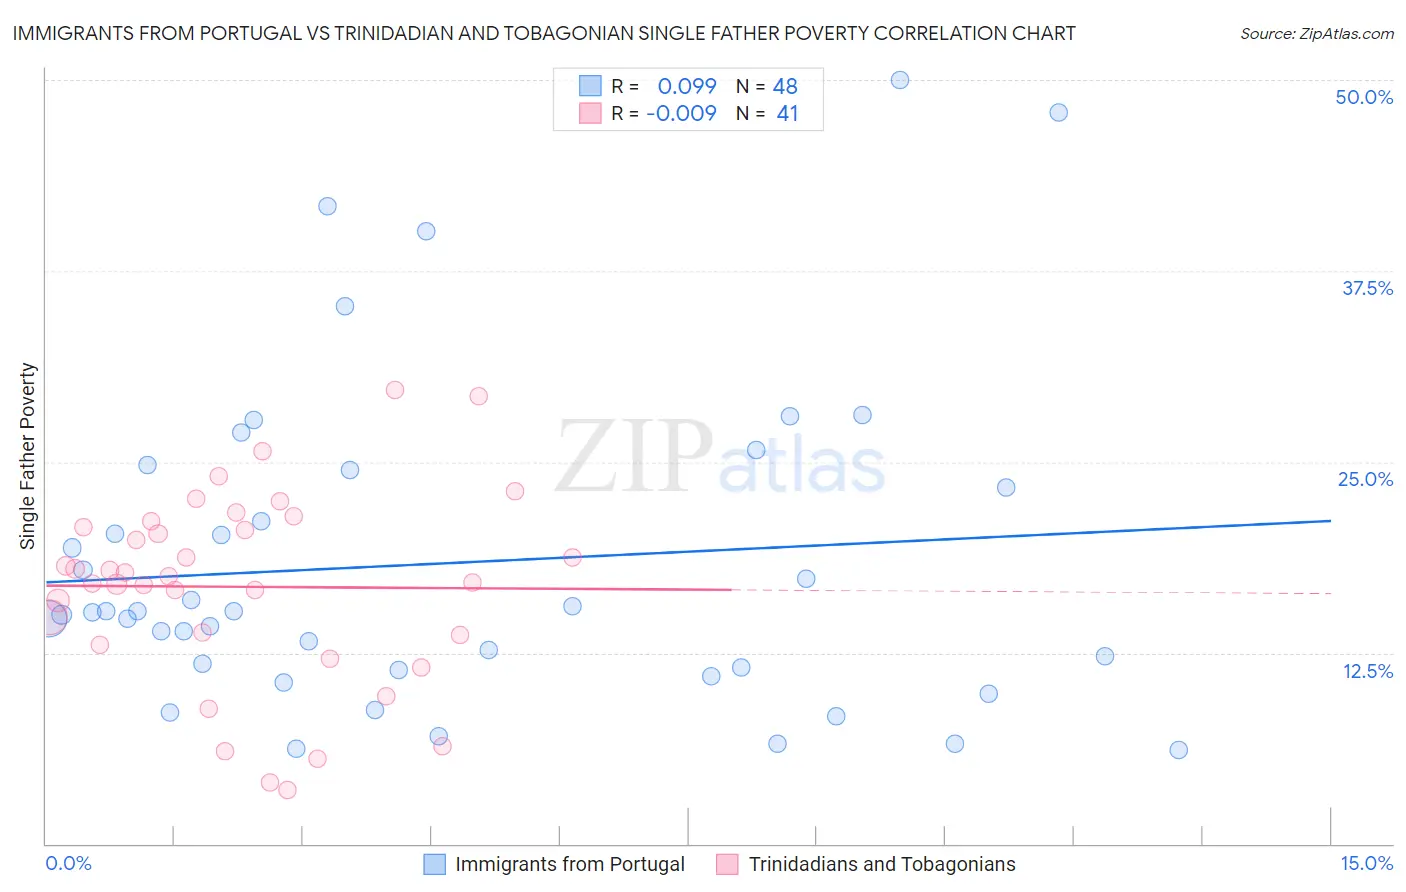
Immigrants from Portugal vs Trinidadian and Tobagonian Single Father Poverty Correlation Chart
The statistical analysis conducted on geographies consisting of 145,028,103 people shows a slight positive correlation between the proportion of Immigrants from Portugal and poverty level among single fathers in the United States with a correlation coefficient (R) of 0.099 and weighted average of 15.9%. Similarly, the statistical analysis conducted on geographies consisting of 188,831,779 people shows no correlation between the proportion of Trinidadians and Tobagonians and poverty level among single fathers in the United States with a correlation coefficient (R) of -0.009 and weighted average of 17.0%, a difference of 7.2%.
Single Father Poverty Correlation Summary
| Measurement | Immigrants from Portugal | Trinidadian and Tobagonian |
| Minimum | 6.1% | 3.5% |
| Maximum | 50.0% | 29.7% |
| Range | 43.9% | 26.2% |
| Mean | 18.4% | 16.8% |
| Median | 15.2% | 17.5% |
| Interquartile 25% (IQ1) | 11.4% | 13.4% |
| Interquartile 75% (IQ3) | 23.9% | 20.9% |
| Interquartile Range (IQR) | 12.5% | 7.6% |
| Standard Deviation (Sample) | 10.6% | 6.3% |
| Standard Deviation (Population) | 10.5% | 6.2% |
Similar Demographics by Single Father Poverty
Demographics Similar to Immigrants from Portugal by Single Father Poverty
In terms of single father poverty, the demographic groups most similar to Immigrants from Portugal are Immigrants from Syria (15.9%, a difference of 0.020%), Norwegian (15.9%, a difference of 0.060%), Nicaraguan (15.9%, a difference of 0.060%), Immigrants from West Indies (15.9%, a difference of 0.14%), and Immigrants from South America (15.9%, a difference of 0.14%).
| Demographics | Rating | Rank | Single Father Poverty |
| Iraqis | 91.2 /100 | #125 | Exceptional 15.9% |
| Hmong | 91.1 /100 | #126 | Exceptional 15.9% |
| Immigrants | Liberia | 91.1 /100 | #127 | Exceptional 15.9% |
| Immigrants | Nigeria | 90.8 /100 | #128 | Exceptional 15.9% |
| Immigrants | West Indies | 90.8 /100 | #129 | Exceptional 15.9% |
| Norwegians | 90.2 /100 | #130 | Exceptional 15.9% |
| Nicaraguans | 90.1 /100 | #131 | Exceptional 15.9% |
| Immigrants | Portugal | 89.7 /100 | #132 | Excellent 15.9% |
| Immigrants | Syria | 89.5 /100 | #133 | Excellent 15.9% |
| Immigrants | South America | 88.5 /100 | #134 | Excellent 15.9% |
| Immigrants | Sri Lanka | 88.2 /100 | #135 | Excellent 15.9% |
| Cypriots | 87.5 /100 | #136 | Excellent 15.9% |
| Immigrants | Azores | 87.2 /100 | #137 | Excellent 15.9% |
| Central Americans | 87.1 /100 | #138 | Excellent 16.0% |
| South Americans | 85.9 /100 | #139 | Excellent 16.0% |
Demographics Similar to Trinidadians and Tobagonians by Single Father Poverty
In terms of single father poverty, the demographic groups most similar to Trinidadians and Tobagonians are Honduran (17.0%, a difference of 0.040%), Immigrants from Ireland (17.1%, a difference of 0.040%), Immigrants from Cabo Verde (17.0%, a difference of 0.060%), Greek (17.1%, a difference of 0.14%), and Czechoslovakian (17.1%, a difference of 0.14%).
| Demographics | Rating | Rank | Single Father Poverty |
| Immigrants | Saudi Arabia | 2.7 /100 | #238 | Tragic 16.9% |
| Bermudans | 2.6 /100 | #239 | Tragic 16.9% |
| Finns | 2.6 /100 | #240 | Tragic 16.9% |
| Czechs | 2.3 /100 | #241 | Tragic 17.0% |
| Moroccans | 2.1 /100 | #242 | Tragic 17.0% |
| Immigrants | Cabo Verde | 1.6 /100 | #243 | Tragic 17.0% |
| Hondurans | 1.6 /100 | #244 | Tragic 17.0% |
| Trinidadians and Tobagonians | 1.5 /100 | #245 | Tragic 17.0% |
| Immigrants | Ireland | 1.4 /100 | #246 | Tragic 17.1% |
| Greeks | 1.3 /100 | #247 | Tragic 17.1% |
| Czechoslovakians | 1.3 /100 | #248 | Tragic 17.1% |
| Canadians | 1.3 /100 | #249 | Tragic 17.1% |
| Austrians | 1.1 /100 | #250 | Tragic 17.1% |
| Luxembourgers | 1.1 /100 | #251 | Tragic 17.1% |
| Croatians | 1.0 /100 | #252 | Tragic 17.1% |