Delaware vs Osage Single Father Poverty
COMPARE
Delaware
Osage
Single Father Poverty
Single Father Poverty Comparison
Delaware
Osage
18.9%
SINGLE FATHER POVERTY
0.0/ 100
METRIC RATING
314th/ 347
METRIC RANK
19.0%
SINGLE FATHER POVERTY
0.0/ 100
METRIC RATING
316th/ 347
METRIC RANK
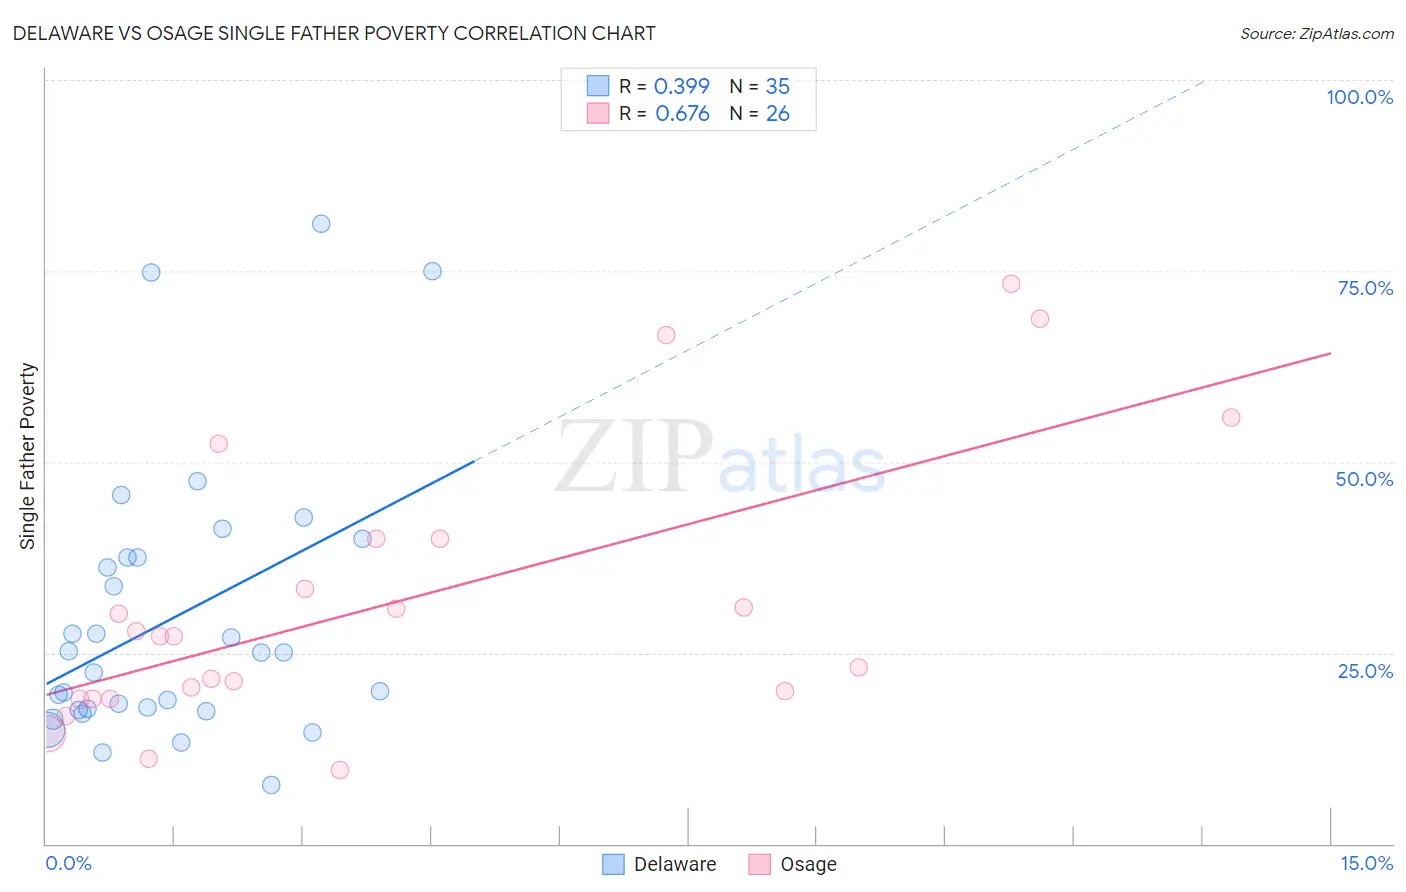
Delaware vs Osage Single Father Poverty Correlation Chart
The statistical analysis conducted on geographies consisting of 86,574,131 people shows a mild positive correlation between the proportion of Delaware and poverty level among single fathers in the United States with a correlation coefficient (R) of 0.399 and weighted average of 18.9%. Similarly, the statistical analysis conducted on geographies consisting of 82,975,637 people shows a significant positive correlation between the proportion of Osage and poverty level among single fathers in the United States with a correlation coefficient (R) of 0.676 and weighted average of 19.0%, a difference of 0.56%.
Single Father Poverty Correlation Summary
| Measurement | Delaware | Osage |
| Minimum | 7.7% | 9.7% |
| Maximum | 81.2% | 73.3% |
| Range | 73.6% | 63.7% |
| Mean | 29.6% | 31.5% |
| Median | 25.0% | 27.1% |
| Interquartile 25% (IQ1) | 17.5% | 19.0% |
| Interquartile 75% (IQ3) | 37.5% | 40.0% |
| Interquartile Range (IQR) | 20.1% | 21.0% |
| Standard Deviation (Sample) | 18.0% | 17.9% |
| Standard Deviation (Population) | 17.7% | 17.5% |
Demographics Similar to Delaware and Osage by Single Father Poverty
In terms of single father poverty, the demographic groups most similar to Delaware are Potawatomi (18.9%, a difference of 0.16%), Chickasaw (19.0%, a difference of 0.16%), Immigrants from Dominica (18.9%, a difference of 0.36%), Nonimmigrants (18.8%, a difference of 0.42%), and Chippewa (18.8%, a difference of 0.61%). Similarly, the demographic groups most similar to Osage are Dominican (19.1%, a difference of 0.31%), Chickasaw (19.0%, a difference of 0.40%), Potawatomi (18.9%, a difference of 0.72%), Dutch West Indian (19.2%, a difference of 0.89%), and Immigrants from Dominica (18.9%, a difference of 0.93%).
| Demographics | Rating | Rank | Single Father Poverty |
| Blackfeet | 0.0 /100 | #305 | Tragic 18.5% |
| Scotch-Irish | 0.0 /100 | #306 | Tragic 18.6% |
| French Canadians | 0.0 /100 | #307 | Tragic 18.6% |
| Ottawa | 0.0 /100 | #308 | Tragic 18.6% |
| Immigrants | Micronesia | 0.0 /100 | #309 | Tragic 18.6% |
| Chippewa | 0.0 /100 | #310 | Tragic 18.8% |
| Immigrants | Nonimmigrants | 0.0 /100 | #311 | Tragic 18.8% |
| Immigrants | Dominica | 0.0 /100 | #312 | Tragic 18.9% |
| Potawatomi | 0.0 /100 | #313 | Tragic 18.9% |
| Delaware | 0.0 /100 | #314 | Tragic 18.9% |
| Chickasaw | 0.0 /100 | #315 | Tragic 19.0% |
| Osage | 0.0 /100 | #316 | Tragic 19.0% |
| Dominicans | 0.0 /100 | #317 | Tragic 19.1% |
| Dutch West Indians | 0.0 /100 | #318 | Tragic 19.2% |
| Slovaks | 0.0 /100 | #319 | Tragic 19.3% |
| Inupiat | 0.0 /100 | #320 | Tragic 19.5% |
| Cherokee | 0.0 /100 | #321 | Tragic 19.6% |
| Creek | 0.0 /100 | #322 | Tragic 19.8% |
| Pennsylvania Germans | 0.0 /100 | #323 | Tragic 20.0% |
| Americans | 0.0 /100 | #324 | Tragic 20.1% |
| Blacks/African Americans | 0.0 /100 | #325 | Tragic 20.4% |