Hopi vs Osage Single Father Poverty
COMPARE
Hopi
Osage
Single Father Poverty
Single Father Poverty Comparison
Hopi
Osage
27.2%
SINGLE FATHER POVERTY
0.0/ 100
METRIC RATING
341st/ 347
METRIC RANK
19.0%
SINGLE FATHER POVERTY
0.0/ 100
METRIC RATING
316th/ 347
METRIC RANK
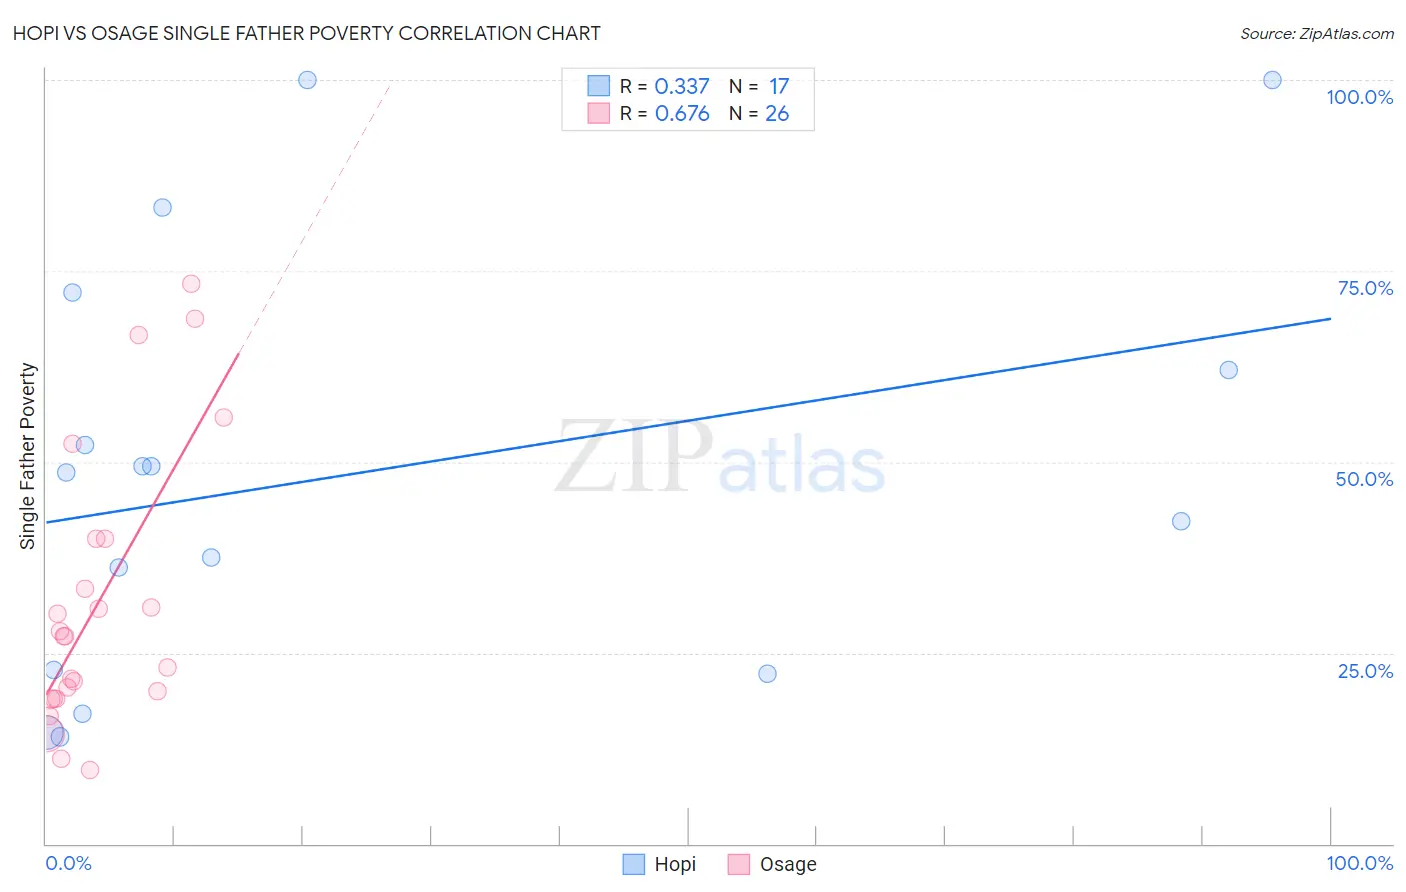
Hopi vs Osage Single Father Poverty Correlation Chart
The statistical analysis conducted on geographies consisting of 69,635,854 people shows a mild positive correlation between the proportion of Hopi and poverty level among single fathers in the United States with a correlation coefficient (R) of 0.337 and weighted average of 27.2%. Similarly, the statistical analysis conducted on geographies consisting of 82,975,637 people shows a significant positive correlation between the proportion of Osage and poverty level among single fathers in the United States with a correlation coefficient (R) of 0.676 and weighted average of 19.0%, a difference of 42.7%.
Single Father Poverty Correlation Summary
| Measurement | Hopi | Osage |
| Minimum | 14.0% | 9.7% |
| Maximum | 100.0% | 73.3% |
| Range | 86.0% | 63.7% |
| Mean | 48.4% | 31.5% |
| Median | 48.6% | 27.1% |
| Interquartile 25% (IQ1) | 22.5% | 19.0% |
| Interquartile 75% (IQ3) | 67.1% | 40.0% |
| Interquartile Range (IQR) | 44.7% | 21.0% |
| Standard Deviation (Sample) | 27.7% | 17.9% |
| Standard Deviation (Population) | 26.9% | 17.5% |
Similar Demographics by Single Father Poverty
Demographics Similar to Hopi by Single Father Poverty
In terms of single father poverty, the demographic groups most similar to Hopi are Houma (26.7%, a difference of 1.6%), Yuman (28.4%, a difference of 4.5%), Lumbee (28.5%, a difference of 4.9%), Navajo (29.2%, a difference of 7.6%), and Crow (30.3%, a difference of 11.5%).
| Demographics | Rating | Rank | Single Father Poverty |
| Natives/Alaskans | 0.0 /100 | #333 | Tragic 22.4% |
| Kiowa | 0.0 /100 | #334 | Tragic 22.5% |
| Shoshone | 0.0 /100 | #335 | Tragic 22.9% |
| Cajuns | 0.0 /100 | #336 | Tragic 23.1% |
| Sioux | 0.0 /100 | #337 | Tragic 23.9% |
| Arapaho | 0.0 /100 | #338 | Tragic 24.0% |
| Apache | 0.0 /100 | #339 | Tragic 24.2% |
| Houma | 0.0 /100 | #340 | Tragic 26.7% |
| Hopi | 0.0 /100 | #341 | Tragic 27.2% |
| Yuman | 0.0 /100 | #342 | Tragic 28.4% |
| Lumbee | 0.0 /100 | #343 | Tragic 28.5% |
| Navajo | 0.0 /100 | #344 | Tragic 29.2% |
| Crow | 0.0 /100 | #345 | Tragic 30.3% |
| Puerto Ricans | 0.0 /100 | #346 | Tragic 31.5% |
| Yup'ik | 0.0 /100 | #347 | Tragic 32.5% |
Demographics Similar to Osage by Single Father Poverty
In terms of single father poverty, the demographic groups most similar to Osage are Dominican (19.1%, a difference of 0.31%), Chickasaw (19.0%, a difference of 0.40%), Delaware (18.9%, a difference of 0.56%), Potawatomi (18.9%, a difference of 0.72%), and Dutch West Indian (19.2%, a difference of 0.89%).
| Demographics | Rating | Rank | Single Father Poverty |
| Immigrants | Micronesia | 0.0 /100 | #309 | Tragic 18.6% |
| Chippewa | 0.0 /100 | #310 | Tragic 18.8% |
| Immigrants | Nonimmigrants | 0.0 /100 | #311 | Tragic 18.8% |
| Immigrants | Dominica | 0.0 /100 | #312 | Tragic 18.9% |
| Potawatomi | 0.0 /100 | #313 | Tragic 18.9% |
| Delaware | 0.0 /100 | #314 | Tragic 18.9% |
| Chickasaw | 0.0 /100 | #315 | Tragic 19.0% |
| Osage | 0.0 /100 | #316 | Tragic 19.0% |
| Dominicans | 0.0 /100 | #317 | Tragic 19.1% |
| Dutch West Indians | 0.0 /100 | #318 | Tragic 19.2% |
| Slovaks | 0.0 /100 | #319 | Tragic 19.3% |
| Inupiat | 0.0 /100 | #320 | Tragic 19.5% |
| Cherokee | 0.0 /100 | #321 | Tragic 19.6% |
| Creek | 0.0 /100 | #322 | Tragic 19.8% |
| Pennsylvania Germans | 0.0 /100 | #323 | Tragic 20.0% |