Menominee vs Iroquois Female Poverty
COMPARE
Menominee
Iroquois
Female Poverty
Female Poverty Comparison
Menominee
Iroquois
17.6%
FEMALE POVERTY
0.0/ 100
METRIC RATING
322nd/ 347
METRIC RANK
15.8%
FEMALE POVERTY
0.1/ 100
METRIC RATING
269th/ 347
METRIC RANK
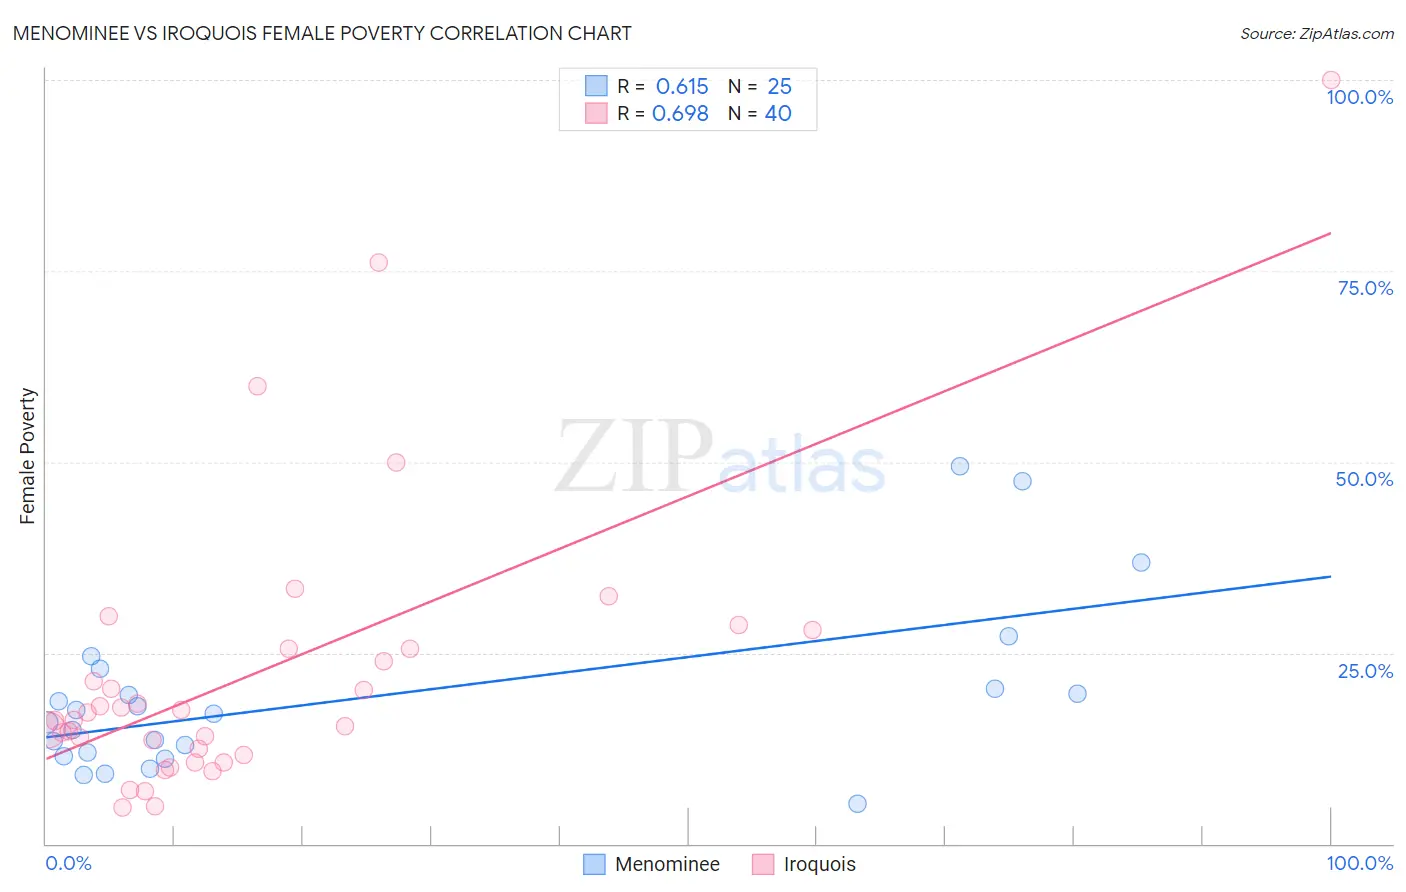
Menominee vs Iroquois Female Poverty Correlation Chart
The statistical analysis conducted on geographies consisting of 45,777,591 people shows a significant positive correlation between the proportion of Menominee and poverty level among females in the United States with a correlation coefficient (R) of 0.615 and weighted average of 17.6%. Similarly, the statistical analysis conducted on geographies consisting of 207,228,109 people shows a significant positive correlation between the proportion of Iroquois and poverty level among females in the United States with a correlation coefficient (R) of 0.698 and weighted average of 15.8%, a difference of 11.2%.
Female Poverty Correlation Summary
| Measurement | Menominee | Iroquois |
| Minimum | 5.2% | 4.7% |
| Maximum | 49.5% | 100.0% |
| Range | 44.2% | 95.3% |
| Mean | 19.1% | 22.4% |
| Median | 17.0% | 16.7% |
| Interquartile 25% (IQ1) | 11.7% | 12.0% |
| Interquartile 75% (IQ3) | 21.6% | 25.5% |
| Interquartile Range (IQR) | 10.0% | 13.5% |
| Standard Deviation (Sample) | 11.1% | 19.0% |
| Standard Deviation (Population) | 10.9% | 18.8% |
Similar Demographics by Female Poverty
Demographics Similar to Menominee by Female Poverty
In terms of female poverty, the demographic groups most similar to Menominee are Paiute (17.7%, a difference of 0.59%), Arapaho (17.5%, a difference of 0.65%), Immigrants from Dominica (17.5%, a difference of 0.72%), Immigrants from Honduras (17.7%, a difference of 0.77%), and Cajun (17.5%, a difference of 0.80%).
| Demographics | Rating | Rank | Female Poverty |
| U.S. Virgin Islanders | 0.0 /100 | #315 | Tragic 17.3% |
| Hondurans | 0.0 /100 | #316 | Tragic 17.4% |
| Immigrants | Congo | 0.0 /100 | #317 | Tragic 17.4% |
| Ute | 0.0 /100 | #318 | Tragic 17.5% |
| Cajuns | 0.0 /100 | #319 | Tragic 17.5% |
| Immigrants | Dominica | 0.0 /100 | #320 | Tragic 17.5% |
| Arapaho | 0.0 /100 | #321 | Tragic 17.5% |
| Menominee | 0.0 /100 | #322 | Tragic 17.6% |
| Paiute | 0.0 /100 | #323 | Tragic 17.7% |
| Immigrants | Honduras | 0.0 /100 | #324 | Tragic 17.7% |
| Colville | 0.0 /100 | #325 | Tragic 17.8% |
| Central American Indians | 0.0 /100 | #326 | Tragic 18.0% |
| Yakama | 0.0 /100 | #327 | Tragic 18.0% |
| Blacks/African Americans | 0.0 /100 | #328 | Tragic 18.6% |
| Kiowa | 0.0 /100 | #329 | Tragic 18.6% |
Demographics Similar to Iroquois by Female Poverty
In terms of female poverty, the demographic groups most similar to Iroquois are Chickasaw (15.9%, a difference of 0.26%), Immigrants from Nicaragua (15.8%, a difference of 0.37%), Subsaharan African (15.8%, a difference of 0.43%), Immigrants from St. Vincent and the Grenadines (15.9%, a difference of 0.54%), and Belizean (15.9%, a difference of 0.76%).
| Demographics | Rating | Rank | Female Poverty |
| Mexican American Indians | 0.1 /100 | #262 | Tragic 15.6% |
| Cherokee | 0.1 /100 | #263 | Tragic 15.6% |
| Immigrants | Ecuador | 0.1 /100 | #264 | Tragic 15.6% |
| Immigrants | Liberia | 0.1 /100 | #265 | Tragic 15.7% |
| Immigrants | El Salvador | 0.1 /100 | #266 | Tragic 15.7% |
| Sub-Saharan Africans | 0.1 /100 | #267 | Tragic 15.8% |
| Immigrants | Nicaragua | 0.1 /100 | #268 | Tragic 15.8% |
| Iroquois | 0.1 /100 | #269 | Tragic 15.8% |
| Chickasaw | 0.1 /100 | #270 | Tragic 15.9% |
| Immigrants | St. Vincent and the Grenadines | 0.0 /100 | #271 | Tragic 15.9% |
| Belizeans | 0.0 /100 | #272 | Tragic 15.9% |
| Haitians | 0.0 /100 | #273 | Tragic 15.9% |
| Barbadians | 0.0 /100 | #274 | Tragic 15.9% |
| Immigrants | Barbados | 0.0 /100 | #275 | Tragic 16.0% |
| Central Americans | 0.0 /100 | #276 | Tragic 16.0% |