Menominee vs Delaware Female Poverty
COMPARE
Menominee
Delaware
Female Poverty
Female Poverty Comparison
Menominee
Delaware
17.6%
FEMALE POVERTY
0.0/ 100
METRIC RATING
322nd/ 347
METRIC RANK
13.7%
FEMALE POVERTY
31.1/ 100
METRIC RATING
194th/ 347
METRIC RANK
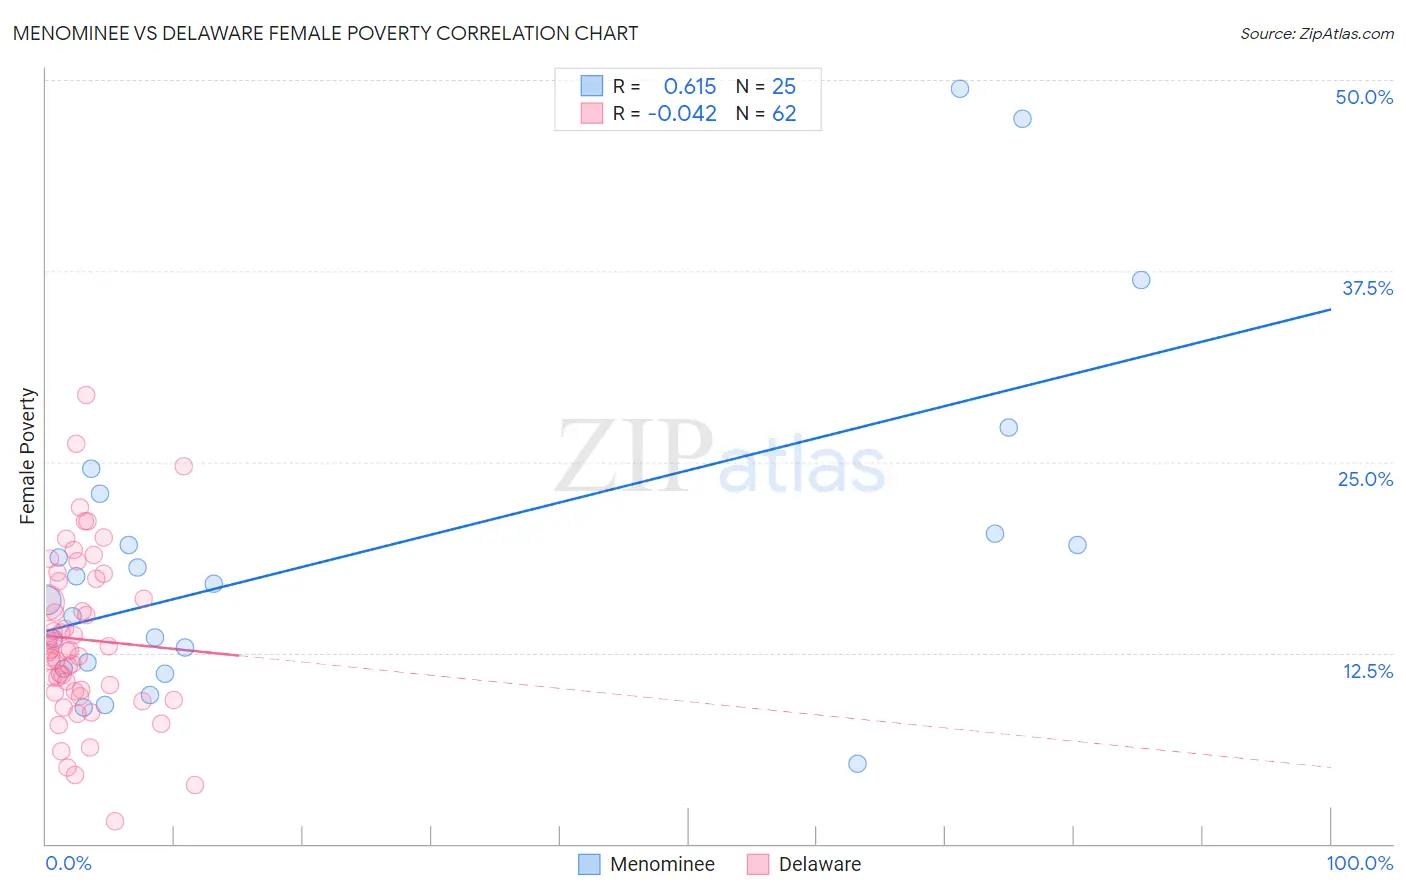
Menominee vs Delaware Female Poverty Correlation Chart
The statistical analysis conducted on geographies consisting of 45,777,591 people shows a significant positive correlation between the proportion of Menominee and poverty level among females in the United States with a correlation coefficient (R) of 0.615 and weighted average of 17.6%. Similarly, the statistical analysis conducted on geographies consisting of 96,212,785 people shows no correlation between the proportion of Delaware and poverty level among females in the United States with a correlation coefficient (R) of -0.042 and weighted average of 13.7%, a difference of 28.4%.
Female Poverty Correlation Summary
| Measurement | Menominee | Delaware |
| Minimum | 5.2% | 1.5% |
| Maximum | 49.5% | 29.4% |
| Range | 44.2% | 27.9% |
| Mean | 19.1% | 13.4% |
| Median | 17.0% | 12.6% |
| Interquartile 25% (IQ1) | 11.7% | 10.0% |
| Interquartile 75% (IQ3) | 21.6% | 17.2% |
| Interquartile Range (IQR) | 10.0% | 7.2% |
| Standard Deviation (Sample) | 11.1% | 5.4% |
| Standard Deviation (Population) | 10.9% | 5.4% |
Similar Demographics by Female Poverty
Demographics Similar to Menominee by Female Poverty
In terms of female poverty, the demographic groups most similar to Menominee are Paiute (17.7%, a difference of 0.59%), Arapaho (17.5%, a difference of 0.65%), Immigrants from Dominica (17.5%, a difference of 0.72%), Immigrants from Honduras (17.7%, a difference of 0.77%), and Cajun (17.5%, a difference of 0.80%).
| Demographics | Rating | Rank | Female Poverty |
| U.S. Virgin Islanders | 0.0 /100 | #315 | Tragic 17.3% |
| Hondurans | 0.0 /100 | #316 | Tragic 17.4% |
| Immigrants | Congo | 0.0 /100 | #317 | Tragic 17.4% |
| Ute | 0.0 /100 | #318 | Tragic 17.5% |
| Cajuns | 0.0 /100 | #319 | Tragic 17.5% |
| Immigrants | Dominica | 0.0 /100 | #320 | Tragic 17.5% |
| Arapaho | 0.0 /100 | #321 | Tragic 17.5% |
| Menominee | 0.0 /100 | #322 | Tragic 17.6% |
| Paiute | 0.0 /100 | #323 | Tragic 17.7% |
| Immigrants | Honduras | 0.0 /100 | #324 | Tragic 17.7% |
| Colville | 0.0 /100 | #325 | Tragic 17.8% |
| Central American Indians | 0.0 /100 | #326 | Tragic 18.0% |
| Yakama | 0.0 /100 | #327 | Tragic 18.0% |
| Blacks/African Americans | 0.0 /100 | #328 | Tragic 18.6% |
| Kiowa | 0.0 /100 | #329 | Tragic 18.6% |
Demographics Similar to Delaware by Female Poverty
In terms of female poverty, the demographic groups most similar to Delaware are Immigrants from South America (13.7%, a difference of 0.060%), Iraqi (13.7%, a difference of 0.070%), Immigrants from Costa Rica (13.7%, a difference of 0.080%), Immigrants from Kuwait (13.7%, a difference of 0.17%), and Sierra Leonean (13.7%, a difference of 0.21%).
| Demographics | Rating | Rank | Female Poverty |
| Immigrants | Venezuela | 41.0 /100 | #187 | Average 13.6% |
| Hawaiians | 39.9 /100 | #188 | Fair 13.6% |
| Uruguayans | 39.8 /100 | #189 | Fair 13.6% |
| Sierra Leoneans | 33.1 /100 | #190 | Fair 13.7% |
| Immigrants | Kuwait | 32.7 /100 | #191 | Fair 13.7% |
| Immigrants | Costa Rica | 31.9 /100 | #192 | Fair 13.7% |
| Iraqis | 31.8 /100 | #193 | Fair 13.7% |
| Delaware | 31.1 /100 | #194 | Fair 13.7% |
| Immigrants | South America | 30.6 /100 | #195 | Fair 13.7% |
| South American Indians | 28.9 /100 | #196 | Fair 13.7% |
| Arabs | 28.6 /100 | #197 | Fair 13.7% |
| Immigrants | Uganda | 28.5 /100 | #198 | Fair 13.7% |
| Immigrants | Lebanon | 25.6 /100 | #199 | Fair 13.8% |
| Spanish | 21.4 /100 | #200 | Fair 13.9% |
| Immigrants | Kenya | 21.1 /100 | #201 | Fair 13.9% |