Menominee vs Immigrants from Eastern Europe Female Poverty
COMPARE
Menominee
Immigrants from Eastern Europe
Female Poverty
Female Poverty Comparison
Menominee
Immigrants from Eastern Europe
17.6%
FEMALE POVERTY
0.0/ 100
METRIC RATING
322nd/ 347
METRIC RANK
12.3%
FEMALE POVERTY
97.2/ 100
METRIC RATING
76th/ 347
METRIC RANK
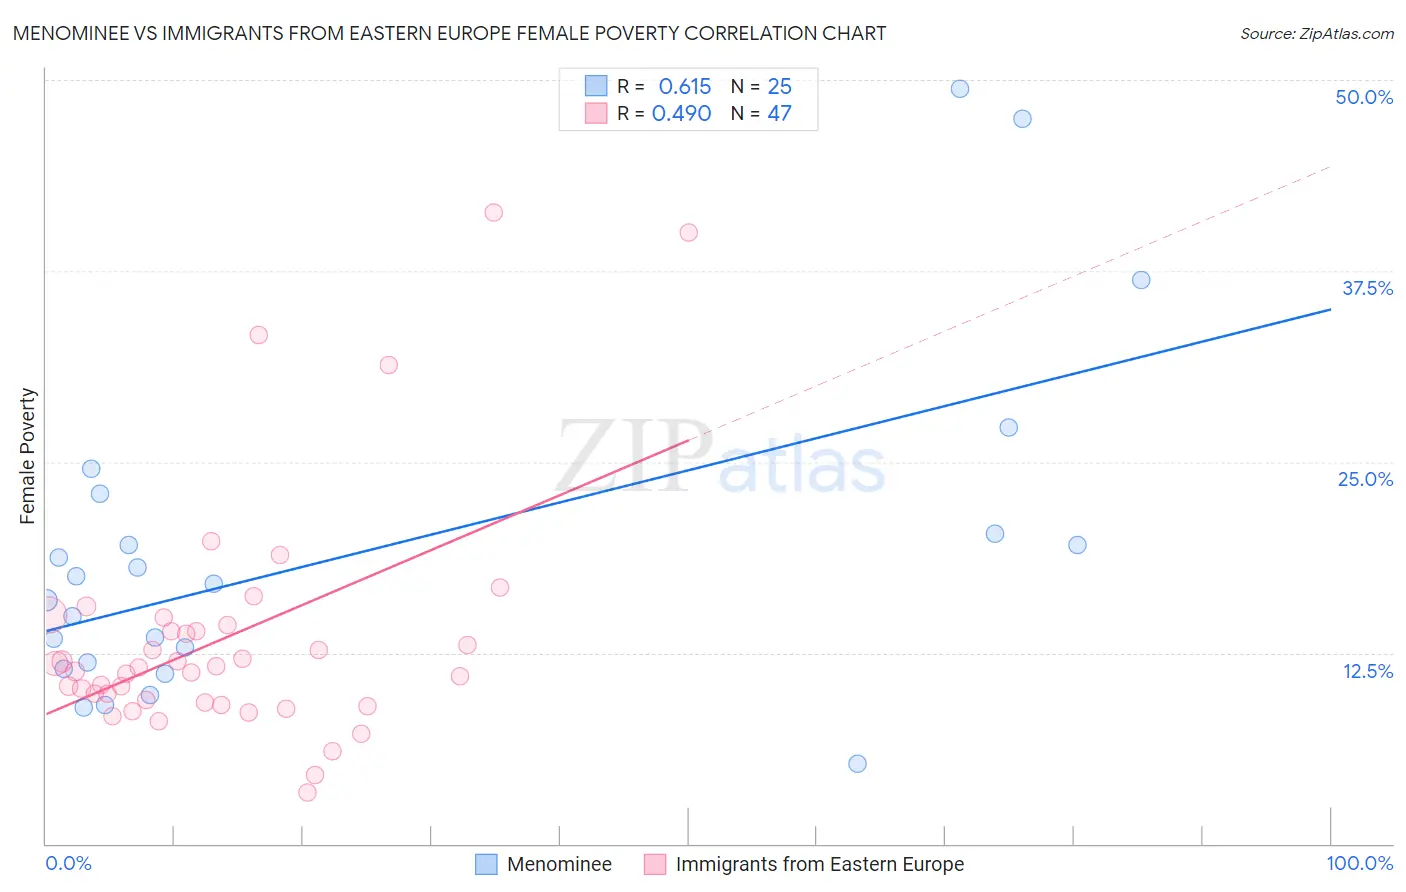
Menominee vs Immigrants from Eastern Europe Female Poverty Correlation Chart
The statistical analysis conducted on geographies consisting of 45,777,591 people shows a significant positive correlation between the proportion of Menominee and poverty level among females in the United States with a correlation coefficient (R) of 0.615 and weighted average of 17.6%. Similarly, the statistical analysis conducted on geographies consisting of 475,295,788 people shows a moderate positive correlation between the proportion of Immigrants from Eastern Europe and poverty level among females in the United States with a correlation coefficient (R) of 0.490 and weighted average of 12.3%, a difference of 43.2%.
Female Poverty Correlation Summary
| Measurement | Menominee | Immigrants from Eastern Europe |
| Minimum | 5.2% | 3.4% |
| Maximum | 49.5% | 41.3% |
| Range | 44.2% | 37.9% |
| Mean | 19.1% | 13.5% |
| Median | 17.0% | 11.6% |
| Interquartile 25% (IQ1) | 11.7% | 9.3% |
| Interquartile 75% (IQ3) | 21.6% | 14.3% |
| Interquartile Range (IQR) | 10.0% | 5.0% |
| Standard Deviation (Sample) | 11.1% | 7.9% |
| Standard Deviation (Population) | 10.9% | 7.8% |
Similar Demographics by Female Poverty
Demographics Similar to Menominee by Female Poverty
In terms of female poverty, the demographic groups most similar to Menominee are Paiute (17.7%, a difference of 0.59%), Arapaho (17.5%, a difference of 0.65%), Immigrants from Dominica (17.5%, a difference of 0.72%), Immigrants from Honduras (17.7%, a difference of 0.77%), and Cajun (17.5%, a difference of 0.80%).
| Demographics | Rating | Rank | Female Poverty |
| U.S. Virgin Islanders | 0.0 /100 | #315 | Tragic 17.3% |
| Hondurans | 0.0 /100 | #316 | Tragic 17.4% |
| Immigrants | Congo | 0.0 /100 | #317 | Tragic 17.4% |
| Ute | 0.0 /100 | #318 | Tragic 17.5% |
| Cajuns | 0.0 /100 | #319 | Tragic 17.5% |
| Immigrants | Dominica | 0.0 /100 | #320 | Tragic 17.5% |
| Arapaho | 0.0 /100 | #321 | Tragic 17.5% |
| Menominee | 0.0 /100 | #322 | Tragic 17.6% |
| Paiute | 0.0 /100 | #323 | Tragic 17.7% |
| Immigrants | Honduras | 0.0 /100 | #324 | Tragic 17.7% |
| Colville | 0.0 /100 | #325 | Tragic 17.8% |
| Central American Indians | 0.0 /100 | #326 | Tragic 18.0% |
| Yakama | 0.0 /100 | #327 | Tragic 18.0% |
| Blacks/African Americans | 0.0 /100 | #328 | Tragic 18.6% |
| Kiowa | 0.0 /100 | #329 | Tragic 18.6% |
Demographics Similar to Immigrants from Eastern Europe by Female Poverty
In terms of female poverty, the demographic groups most similar to Immigrants from Eastern Europe are Serbian (12.3%, a difference of 0.030%), Egyptian (12.3%, a difference of 0.040%), Immigrants from North America (12.3%, a difference of 0.11%), Slovak (12.3%, a difference of 0.16%), and Immigrants from Sweden (12.3%, a difference of 0.16%).
| Demographics | Rating | Rank | Female Poverty |
| Swiss | 97.7 /100 | #69 | Exceptional 12.2% |
| Immigrants | Belgium | 97.7 /100 | #70 | Exceptional 12.2% |
| Carpatho Rusyns | 97.6 /100 | #71 | Exceptional 12.2% |
| Cambodians | 97.5 /100 | #72 | Exceptional 12.2% |
| Zimbabweans | 97.5 /100 | #73 | Exceptional 12.3% |
| Immigrants | Canada | 97.5 /100 | #74 | Exceptional 12.3% |
| Europeans | 97.4 /100 | #75 | Exceptional 12.3% |
| Immigrants | Eastern Europe | 97.2 /100 | #76 | Exceptional 12.3% |
| Serbians | 97.2 /100 | #77 | Exceptional 12.3% |
| Egyptians | 97.2 /100 | #78 | Exceptional 12.3% |
| Immigrants | North America | 97.1 /100 | #79 | Exceptional 12.3% |
| Slovaks | 97.1 /100 | #80 | Exceptional 12.3% |
| Immigrants | Sweden | 97.1 /100 | #81 | Exceptional 12.3% |
| Jordanians | 97.1 /100 | #82 | Exceptional 12.3% |
| Immigrants | England | 96.9 /100 | #83 | Exceptional 12.3% |