Menominee vs Trinidadian and Tobagonian Currently Married
COMPARE
Menominee
Trinidadian and Tobagonian
Currently Married
Currently Married Comparison
Menominee
Trinidadians and Tobagonians
42.3%
CURRENTLY MARRIED
0.0/ 100
METRIC RATING
296th/ 347
METRIC RANK
41.5%
CURRENTLY MARRIED
0.0/ 100
METRIC RATING
311th/ 347
METRIC RANK
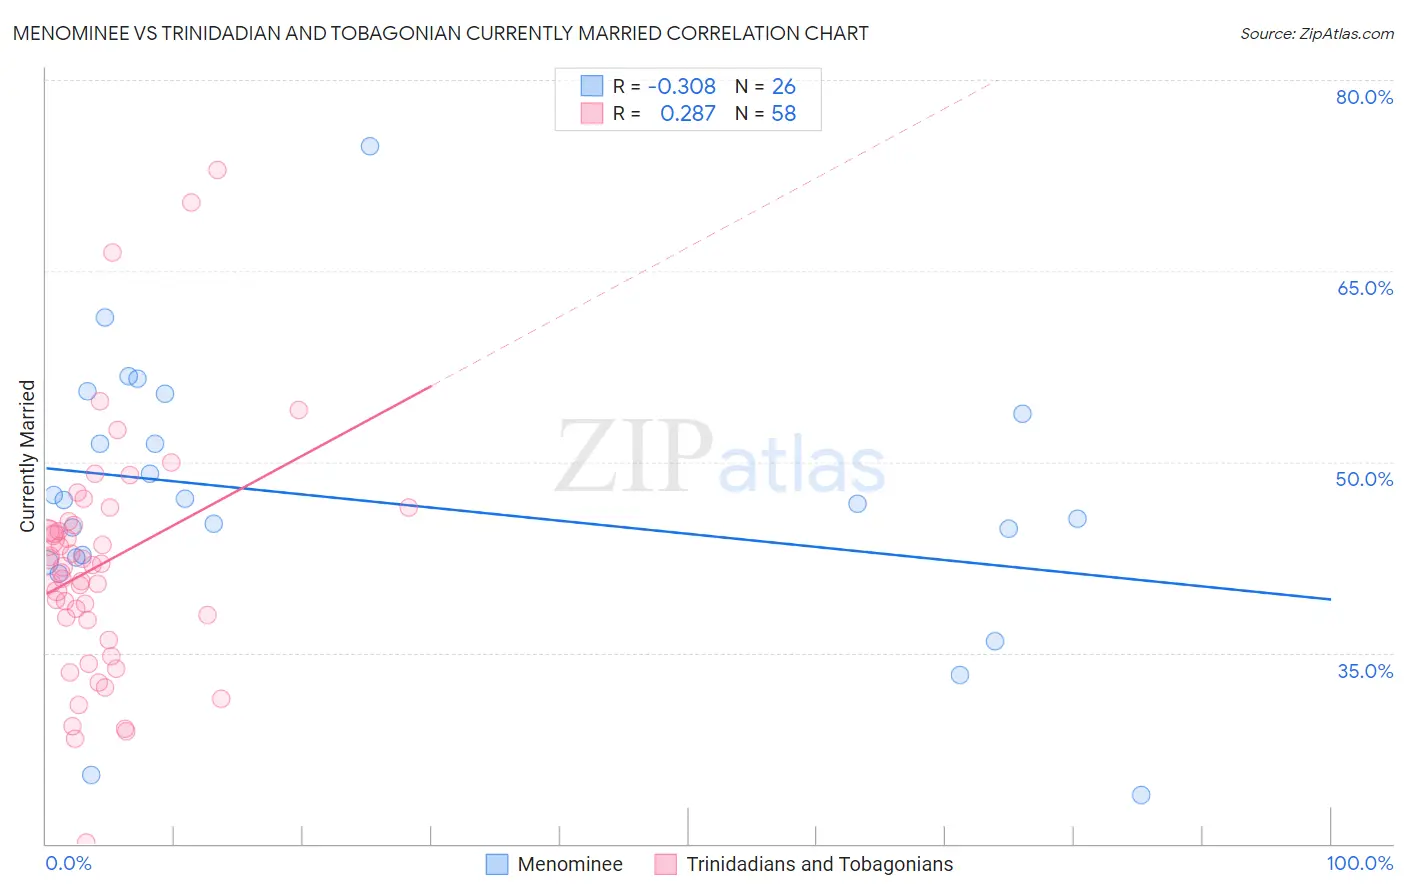
Menominee vs Trinidadian and Tobagonian Currently Married Correlation Chart
The statistical analysis conducted on geographies consisting of 45,778,979 people shows a mild negative correlation between the proportion of Menominee and percentage of population currently married in the United States with a correlation coefficient (R) of -0.308 and weighted average of 42.3%. Similarly, the statistical analysis conducted on geographies consisting of 219,846,005 people shows a weak positive correlation between the proportion of Trinidadians and Tobagonians and percentage of population currently married in the United States with a correlation coefficient (R) of 0.287 and weighted average of 41.5%, a difference of 1.8%.
Currently Married Correlation Summary
| Measurement | Menominee | Trinidadian and Tobagonian |
| Minimum | 23.8% | 20.1% |
| Maximum | 74.8% | 72.9% |
| Range | 51.0% | 52.8% |
| Mean | 47.0% | 41.9% |
| Median | 46.8% | 41.8% |
| Interquartile 25% (IQ1) | 42.5% | 37.6% |
| Interquartile 75% (IQ3) | 53.8% | 45.0% |
| Interquartile Range (IQR) | 11.3% | 7.5% |
| Standard Deviation (Sample) | 10.6% | 9.4% |
| Standard Deviation (Population) | 10.4% | 9.4% |
Demographics Similar to Menominee and Trinidadians and Tobagonians by Currently Married
In terms of currently married, the demographic groups most similar to Menominee are Cheyenne (42.2%, a difference of 0.11%), Immigrants from Honduras (42.2%, a difference of 0.20%), Immigrants from Western Africa (42.4%, a difference of 0.21%), Liberian (42.2%, a difference of 0.23%), and Belizean (42.2%, a difference of 0.33%). Similarly, the demographic groups most similar to Trinidadians and Tobagonians are Guyanese (41.6%, a difference of 0.15%), Somali (41.5%, a difference of 0.18%), Jamaican (41.4%, a difference of 0.47%), Immigrants from Liberia (41.8%, a difference of 0.51%), and Immigrants from Belize (41.8%, a difference of 0.63%).
| Demographics | Rating | Rank | Currently Married |
| Yuman | 0.0 /100 | #293 | Tragic 42.6% |
| Hondurans | 0.0 /100 | #294 | Tragic 42.5% |
| Immigrants | Western Africa | 0.0 /100 | #295 | Tragic 42.4% |
| Menominee | 0.0 /100 | #296 | Tragic 42.3% |
| Cheyenne | 0.0 /100 | #297 | Tragic 42.2% |
| Immigrants | Honduras | 0.0 /100 | #298 | Tragic 42.2% |
| Liberians | 0.0 /100 | #299 | Tragic 42.2% |
| Belizeans | 0.0 /100 | #300 | Tragic 42.2% |
| Immigrants | Yemen | 0.0 /100 | #301 | Tragic 42.1% |
| Immigrants | Zaire | 0.0 /100 | #302 | Tragic 42.0% |
| Sioux | 0.0 /100 | #303 | Tragic 41.9% |
| Immigrants | Bahamas | 0.0 /100 | #304 | Tragic 41.9% |
| Immigrants | Trinidad and Tobago | 0.0 /100 | #305 | Tragic 41.9% |
| Immigrants | Guyana | 0.0 /100 | #306 | Tragic 41.9% |
| Africans | 0.0 /100 | #307 | Tragic 41.8% |
| Immigrants | Belize | 0.0 /100 | #308 | Tragic 41.8% |
| Immigrants | Liberia | 0.0 /100 | #309 | Tragic 41.8% |
| Guyanese | 0.0 /100 | #310 | Tragic 41.6% |
| Trinidadians and Tobagonians | 0.0 /100 | #311 | Tragic 41.5% |
| Somalis | 0.0 /100 | #312 | Tragic 41.5% |
| Jamaicans | 0.0 /100 | #313 | Tragic 41.4% |