Menominee vs Iroquois GED/Equivalency
COMPARE
Menominee
Iroquois
GED/Equivalency
GED/Equivalency Comparison
Menominee
Iroquois
86.3%
GED/EQUIVALENCY
79.3/ 100
METRIC RATING
149th/ 347
METRIC RANK
84.6%
GED/EQUIVALENCY
7.5/ 100
METRIC RATING
222nd/ 347
METRIC RANK
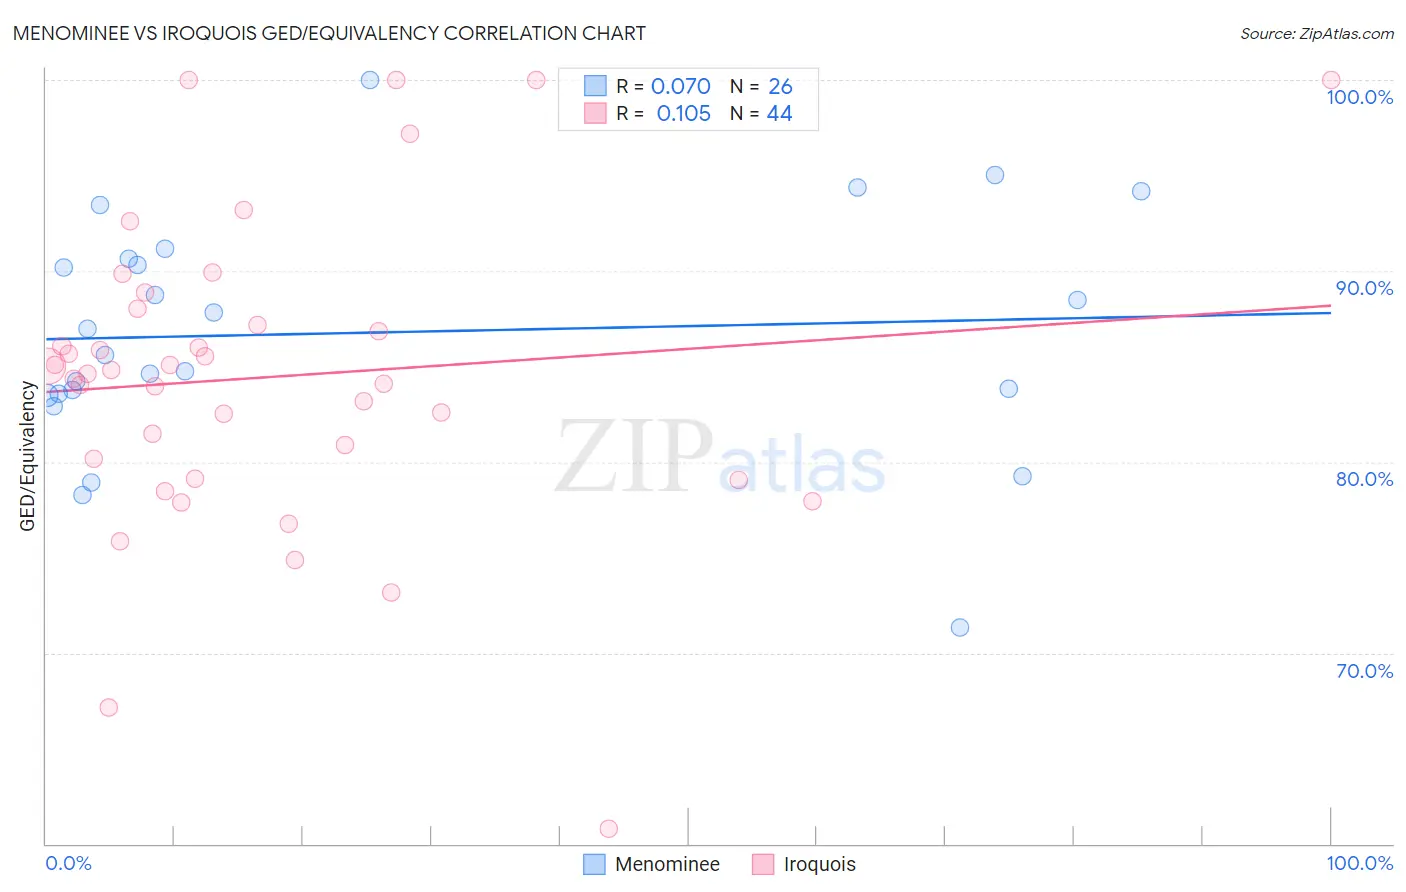
Menominee vs Iroquois GED/Equivalency Correlation Chart
The statistical analysis conducted on geographies consisting of 45,778,979 people shows a slight positive correlation between the proportion of Menominee and percentage of population with at least ged/equivalency education in the United States with a correlation coefficient (R) of 0.070 and weighted average of 86.3%. Similarly, the statistical analysis conducted on geographies consisting of 207,308,653 people shows a poor positive correlation between the proportion of Iroquois and percentage of population with at least ged/equivalency education in the United States with a correlation coefficient (R) of 0.105 and weighted average of 84.6%, a difference of 2.0%.
GED/Equivalency Correlation Summary
| Measurement | Menominee | Iroquois |
| Minimum | 71.3% | 60.8% |
| Maximum | 100.0% | 100.0% |
| Range | 28.7% | 39.2% |
| Mean | 86.8% | 84.4% |
| Median | 86.3% | 84.7% |
| Interquartile 25% (IQ1) | 83.6% | 79.6% |
| Interquartile 75% (IQ3) | 90.6% | 87.6% |
| Interquartile Range (IQR) | 7.1% | 8.0% |
| Standard Deviation (Sample) | 6.2% | 8.1% |
| Standard Deviation (Population) | 6.1% | 8.0% |
Similar Demographics by GED/Equivalency
Demographics Similar to Menominee by GED/Equivalency
In terms of ged/equivalency, the demographic groups most similar to Menominee are Immigrants from Northern Africa (86.3%, a difference of 0.0%), Immigrants from Poland (86.3%, a difference of 0.0%), Basque (86.4%, a difference of 0.010%), Immigrants from Western Asia (86.3%, a difference of 0.010%), and Pakistani (86.4%, a difference of 0.040%).
| Demographics | Rating | Rank | GED/Equivalency |
| Immigrants | Indonesia | 82.4 /100 | #142 | Excellent 86.4% |
| Immigrants | Pakistan | 82.4 /100 | #143 | Excellent 86.4% |
| Bolivians | 82.1 /100 | #144 | Excellent 86.4% |
| Pakistanis | 80.4 /100 | #145 | Excellent 86.4% |
| Basques | 79.5 /100 | #146 | Good 86.4% |
| Immigrants | Northern Africa | 79.3 /100 | #147 | Good 86.3% |
| Immigrants | Poland | 79.3 /100 | #148 | Good 86.3% |
| Menominee | 79.3 /100 | #149 | Good 86.3% |
| Immigrants | Western Asia | 78.8 /100 | #150 | Good 86.3% |
| Immigrants | Bosnia and Herzegovina | 77.9 /100 | #151 | Good 86.3% |
| Brazilians | 77.2 /100 | #152 | Good 86.3% |
| Kenyans | 76.6 /100 | #153 | Good 86.3% |
| Armenians | 76.4 /100 | #154 | Good 86.3% |
| Iraqis | 75.2 /100 | #155 | Good 86.2% |
| Immigrants | Nepal | 73.3 /100 | #156 | Good 86.2% |
Demographics Similar to Iroquois by GED/Equivalency
In terms of ged/equivalency, the demographic groups most similar to Iroquois are Immigrants from Uzbekistan (84.6%, a difference of 0.030%), Taiwanese (84.7%, a difference of 0.040%), Potawatomi (84.7%, a difference of 0.050%), American (84.7%, a difference of 0.050%), and Immigrants from Micronesia (84.7%, a difference of 0.080%).
| Demographics | Rating | Rank | GED/Equivalency |
| Peruvians | 9.2 /100 | #215 | Tragic 84.7% |
| Immigrants | Micronesia | 8.7 /100 | #216 | Tragic 84.7% |
| Nigerians | 8.6 /100 | #217 | Tragic 84.7% |
| Alaska Natives | 8.6 /100 | #218 | Tragic 84.7% |
| Potawatomi | 8.2 /100 | #219 | Tragic 84.7% |
| Americans | 8.2 /100 | #220 | Tragic 84.7% |
| Taiwanese | 8.1 /100 | #221 | Tragic 84.7% |
| Iroquois | 7.5 /100 | #222 | Tragic 84.6% |
| Immigrants | Uzbekistan | 7.1 /100 | #223 | Tragic 84.6% |
| French American Indians | 6.3 /100 | #224 | Tragic 84.6% |
| Immigrants | Thailand | 5.8 /100 | #225 | Tragic 84.5% |
| Immigrants | Zaire | 5.5 /100 | #226 | Tragic 84.5% |
| Immigrants | Costa Rica | 5.4 /100 | #227 | Tragic 84.5% |
| Immigrants | Liberia | 4.9 /100 | #228 | Tragic 84.4% |
| Immigrants | Uruguay | 4.6 /100 | #229 | Tragic 84.4% |