Immigrants from Indonesia vs Iroquois Female Poverty
COMPARE
Immigrants from Indonesia
Iroquois
Female Poverty
Female Poverty Comparison
Immigrants from Indonesia
Iroquois
12.5%
FEMALE POVERTY
95.4/ 100
METRIC RATING
94th/ 347
METRIC RANK
15.8%
FEMALE POVERTY
0.1/ 100
METRIC RATING
269th/ 347
METRIC RANK
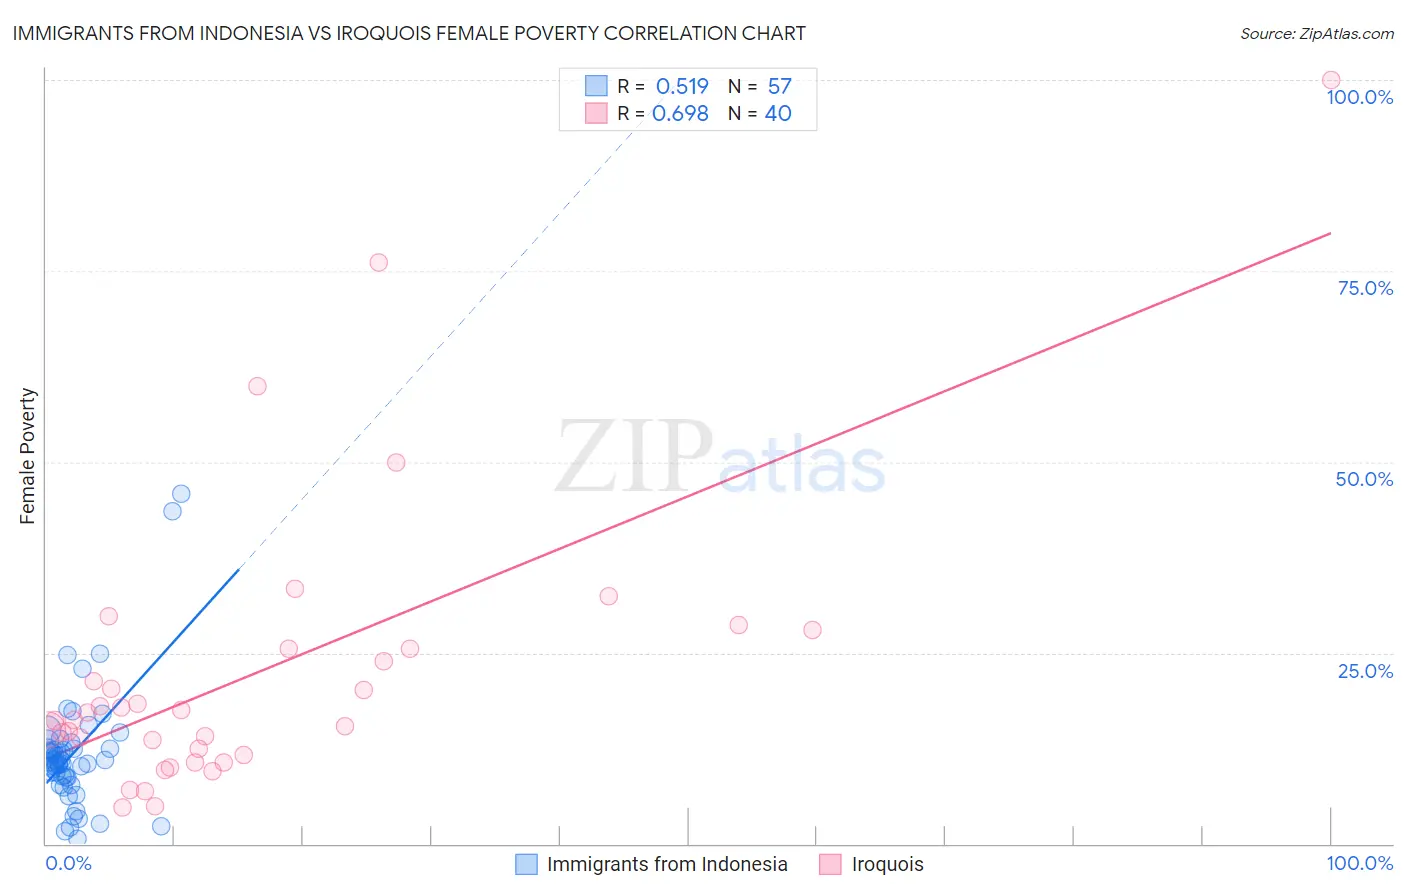
Immigrants from Indonesia vs Iroquois Female Poverty Correlation Chart
The statistical analysis conducted on geographies consisting of 215,706,539 people shows a substantial positive correlation between the proportion of Immigrants from Indonesia and poverty level among females in the United States with a correlation coefficient (R) of 0.519 and weighted average of 12.5%. Similarly, the statistical analysis conducted on geographies consisting of 207,228,109 people shows a significant positive correlation between the proportion of Iroquois and poverty level among females in the United States with a correlation coefficient (R) of 0.698 and weighted average of 15.8%, a difference of 27.0%.
Female Poverty Correlation Summary
| Measurement | Immigrants from Indonesia | Iroquois |
| Minimum | 0.67% | 4.7% |
| Maximum | 45.9% | 100.0% |
| Range | 45.2% | 95.3% |
| Mean | 11.9% | 22.4% |
| Median | 10.7% | 16.7% |
| Interquartile 25% (IQ1) | 8.6% | 12.0% |
| Interquartile 75% (IQ3) | 12.8% | 25.5% |
| Interquartile Range (IQR) | 4.2% | 13.5% |
| Standard Deviation (Sample) | 8.1% | 19.0% |
| Standard Deviation (Population) | 8.0% | 18.8% |
Similar Demographics by Female Poverty
Demographics Similar to Immigrants from Indonesia by Female Poverty
In terms of female poverty, the demographic groups most similar to Immigrants from Indonesia are Immigrants from Egypt (12.5%, a difference of 0.030%), Immigrants from South Africa (12.5%, a difference of 0.040%), British (12.5%, a difference of 0.11%), Australian (12.5%, a difference of 0.14%), and Native Hawaiian (12.5%, a difference of 0.17%).
| Demographics | Rating | Rank | Female Poverty |
| Okinawans | 96.4 /100 | #87 | Exceptional 12.4% |
| Finns | 96.4 /100 | #88 | Exceptional 12.4% |
| English | 96.1 /100 | #89 | Exceptional 12.4% |
| Immigrants | Denmark | 95.8 /100 | #90 | Exceptional 12.4% |
| Belgians | 95.8 /100 | #91 | Exceptional 12.4% |
| Czechoslovakians | 95.7 /100 | #92 | Exceptional 12.4% |
| Immigrants | Egypt | 95.5 /100 | #93 | Exceptional 12.5% |
| Immigrants | Indonesia | 95.4 /100 | #94 | Exceptional 12.5% |
| Immigrants | South Africa | 95.4 /100 | #95 | Exceptional 12.5% |
| British | 95.2 /100 | #96 | Exceptional 12.5% |
| Australians | 95.2 /100 | #97 | Exceptional 12.5% |
| Native Hawaiians | 95.1 /100 | #98 | Exceptional 12.5% |
| Romanians | 95.1 /100 | #99 | Exceptional 12.5% |
| Immigrants | Latvia | 94.8 /100 | #100 | Exceptional 12.5% |
| Tlingit-Haida | 94.8 /100 | #101 | Exceptional 12.5% |
Demographics Similar to Iroquois by Female Poverty
In terms of female poverty, the demographic groups most similar to Iroquois are Chickasaw (15.9%, a difference of 0.26%), Immigrants from Nicaragua (15.8%, a difference of 0.37%), Subsaharan African (15.8%, a difference of 0.43%), Immigrants from St. Vincent and the Grenadines (15.9%, a difference of 0.54%), and Belizean (15.9%, a difference of 0.76%).
| Demographics | Rating | Rank | Female Poverty |
| Mexican American Indians | 0.1 /100 | #262 | Tragic 15.6% |
| Cherokee | 0.1 /100 | #263 | Tragic 15.6% |
| Immigrants | Ecuador | 0.1 /100 | #264 | Tragic 15.6% |
| Immigrants | Liberia | 0.1 /100 | #265 | Tragic 15.7% |
| Immigrants | El Salvador | 0.1 /100 | #266 | Tragic 15.7% |
| Sub-Saharan Africans | 0.1 /100 | #267 | Tragic 15.8% |
| Immigrants | Nicaragua | 0.1 /100 | #268 | Tragic 15.8% |
| Iroquois | 0.1 /100 | #269 | Tragic 15.8% |
| Chickasaw | 0.1 /100 | #270 | Tragic 15.9% |
| Immigrants | St. Vincent and the Grenadines | 0.0 /100 | #271 | Tragic 15.9% |
| Belizeans | 0.0 /100 | #272 | Tragic 15.9% |
| Haitians | 0.0 /100 | #273 | Tragic 15.9% |
| Barbadians | 0.0 /100 | #274 | Tragic 15.9% |
| Immigrants | Barbados | 0.0 /100 | #275 | Tragic 16.0% |
| Central Americans | 0.0 /100 | #276 | Tragic 16.0% |