Menominee vs Blackfeet Single Mother Poverty
COMPARE
Menominee
Blackfeet
Single Mother Poverty
Single Mother Poverty Comparison
Menominee
Blackfeet
37.1%
SINGLE MOTHER POVERTY
0.0/ 100
METRIC RATING
333rd/ 347
METRIC RANK
33.2%
SINGLE MOTHER POVERTY
0.0/ 100
METRIC RATING
296th/ 347
METRIC RANK
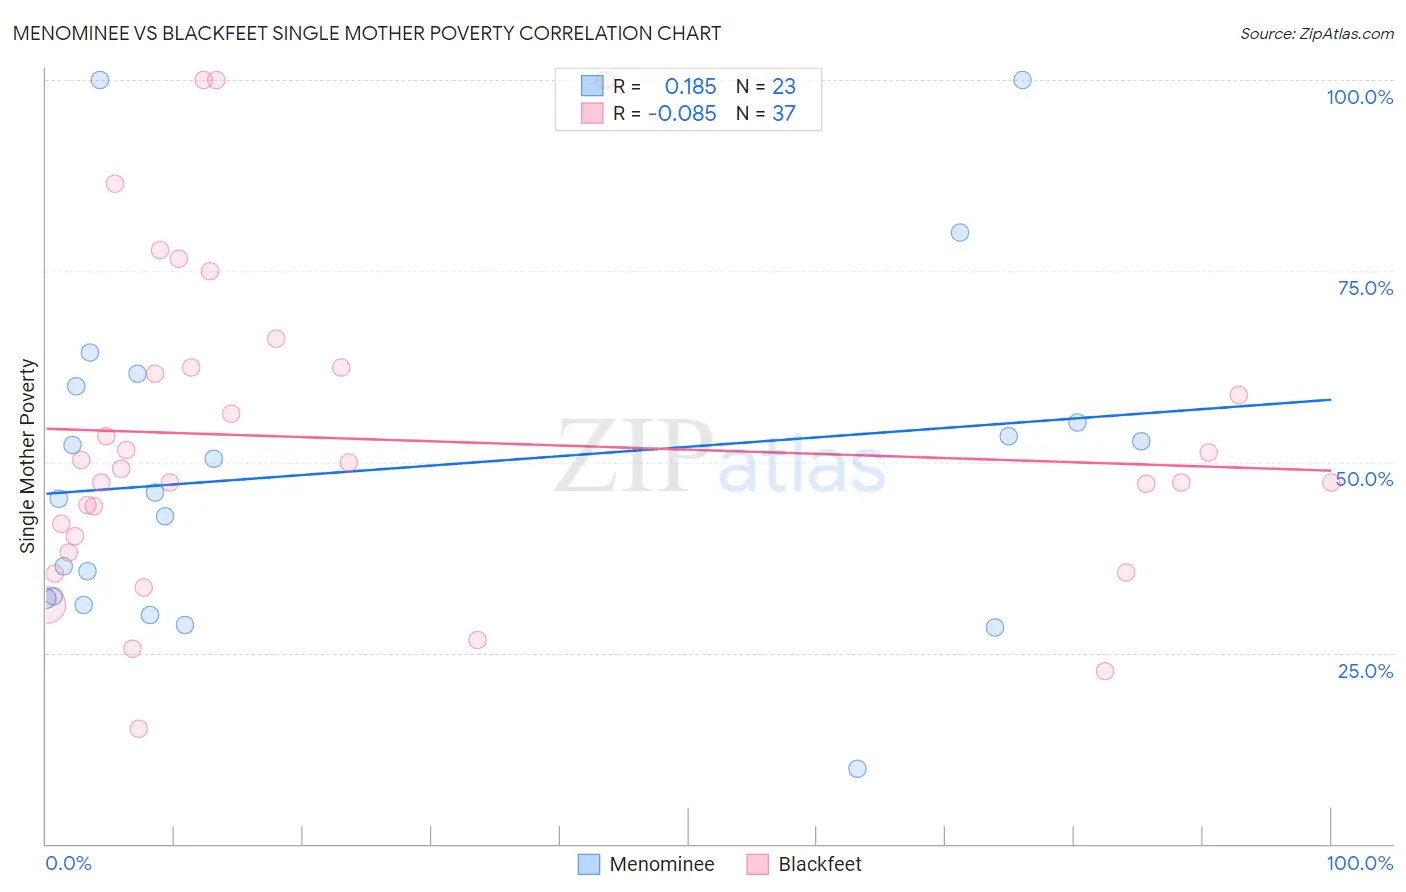
Menominee vs Blackfeet Single Mother Poverty Correlation Chart
The statistical analysis conducted on geographies consisting of 45,498,385 people shows a poor positive correlation between the proportion of Menominee and poverty level among single mothers in the United States with a correlation coefficient (R) of 0.185 and weighted average of 37.1%. Similarly, the statistical analysis conducted on geographies consisting of 305,769,036 people shows a slight negative correlation between the proportion of Blackfeet and poverty level among single mothers in the United States with a correlation coefficient (R) of -0.085 and weighted average of 33.2%, a difference of 11.7%.
Single Mother Poverty Correlation Summary
| Measurement | Menominee | Blackfeet |
| Minimum | 9.8% | 15.0% |
| Maximum | 100.0% | 100.0% |
| Range | 90.2% | 85.0% |
| Mean | 49.1% | 53.0% |
| Median | 46.0% | 49.2% |
| Interquartile 25% (IQ1) | 32.1% | 39.3% |
| Interquartile 75% (IQ3) | 59.9% | 62.4% |
| Interquartile Range (IQR) | 27.8% | 23.1% |
| Standard Deviation (Sample) | 22.1% | 21.1% |
| Standard Deviation (Population) | 21.6% | 20.8% |
Similar Demographics by Single Mother Poverty
Demographics Similar to Menominee by Single Mother Poverty
In terms of single mother poverty, the demographic groups most similar to Menominee are Pueblo (37.2%, a difference of 0.37%), Dutch West Indian (36.8%, a difference of 0.78%), Creek (36.7%, a difference of 1.0%), Native/Alaskan (36.6%, a difference of 1.2%), and Apache (36.6%, a difference of 1.3%).
| Demographics | Rating | Rank | Single Mother Poverty |
| Seminole | 0.0 /100 | #326 | Tragic 35.8% |
| Yakama | 0.0 /100 | #327 | Tragic 36.4% |
| Choctaw | 0.0 /100 | #328 | Tragic 36.4% |
| Apache | 0.0 /100 | #329 | Tragic 36.6% |
| Natives/Alaskans | 0.0 /100 | #330 | Tragic 36.6% |
| Creek | 0.0 /100 | #331 | Tragic 36.7% |
| Dutch West Indians | 0.0 /100 | #332 | Tragic 36.8% |
| Menominee | 0.0 /100 | #333 | Tragic 37.1% |
| Pueblo | 0.0 /100 | #334 | Tragic 37.2% |
| Yuman | 0.0 /100 | #335 | Tragic 37.8% |
| Cheyenne | 0.0 /100 | #336 | Tragic 38.5% |
| Immigrants | Yemen | 0.0 /100 | #337 | Tragic 38.5% |
| Pima | 0.0 /100 | #338 | Tragic 38.6% |
| Crow | 0.0 /100 | #339 | Tragic 38.6% |
| Sioux | 0.0 /100 | #340 | Tragic 38.8% |
Demographics Similar to Blackfeet by Single Mother Poverty
In terms of single mother poverty, the demographic groups most similar to Blackfeet are Pennsylvania German (33.2%, a difference of 0.14%), Yaqui (33.1%, a difference of 0.16%), French American Indian (33.1%, a difference of 0.19%), African (33.3%, a difference of 0.25%), and Immigrants from Guatemala (33.3%, a difference of 0.34%).
| Demographics | Rating | Rank | Single Mother Poverty |
| U.S. Virgin Islanders | 0.0 /100 | #289 | Tragic 32.6% |
| Osage | 0.0 /100 | #290 | Tragic 32.6% |
| Guatemalans | 0.0 /100 | #291 | Tragic 32.9% |
| Shoshone | 0.0 /100 | #292 | Tragic 32.9% |
| Aleuts | 0.0 /100 | #293 | Tragic 32.9% |
| French American Indians | 0.0 /100 | #294 | Tragic 33.1% |
| Yaqui | 0.0 /100 | #295 | Tragic 33.1% |
| Blackfeet | 0.0 /100 | #296 | Tragic 33.2% |
| Pennsylvania Germans | 0.0 /100 | #297 | Tragic 33.2% |
| Africans | 0.0 /100 | #298 | Tragic 33.3% |
| Immigrants | Guatemala | 0.0 /100 | #299 | Tragic 33.3% |
| Hispanics or Latinos | 0.0 /100 | #300 | Tragic 33.3% |
| Immigrants | Somalia | 0.0 /100 | #301 | Tragic 33.4% |
| Arapaho | 0.0 /100 | #302 | Tragic 33.4% |
| Americans | 0.0 /100 | #303 | Tragic 33.5% |