Menominee vs Bulgarian Single Mother Poverty
COMPARE
Menominee
Bulgarian
Single Mother Poverty
Single Mother Poverty Comparison
Menominee
Bulgarians
37.1%
SINGLE MOTHER POVERTY
0.0/ 100
METRIC RATING
333rd/ 347
METRIC RANK
26.5%
SINGLE MOTHER POVERTY
99.9/ 100
METRIC RATING
33rd/ 347
METRIC RANK
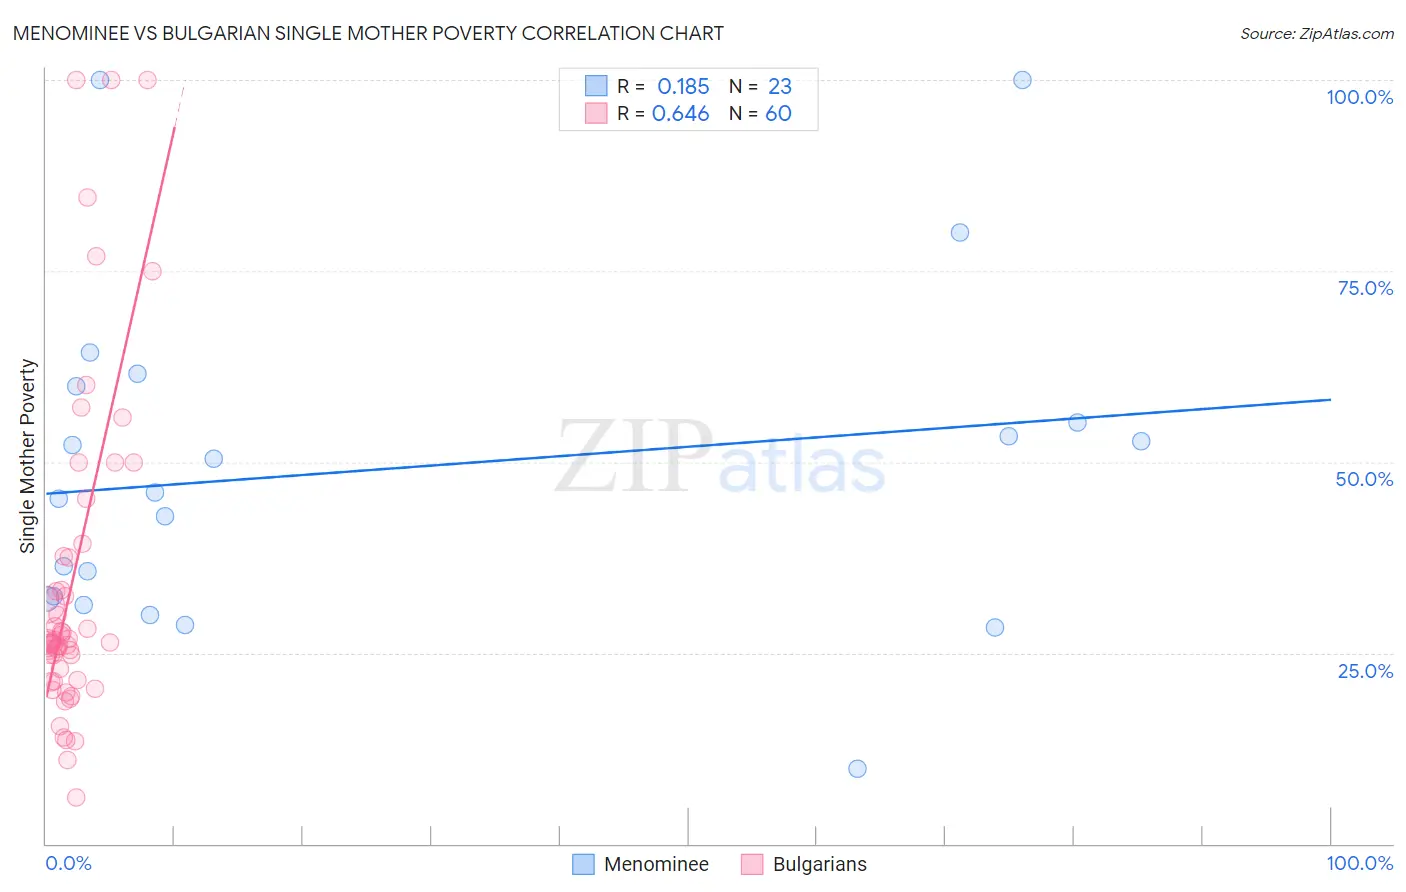
Menominee vs Bulgarian Single Mother Poverty Correlation Chart
The statistical analysis conducted on geographies consisting of 45,498,385 people shows a poor positive correlation between the proportion of Menominee and poverty level among single mothers in the United States with a correlation coefficient (R) of 0.185 and weighted average of 37.1%. Similarly, the statistical analysis conducted on geographies consisting of 202,203,367 people shows a significant positive correlation between the proportion of Bulgarians and poverty level among single mothers in the United States with a correlation coefficient (R) of 0.646 and weighted average of 26.5%, a difference of 39.6%.
Single Mother Poverty Correlation Summary
| Measurement | Menominee | Bulgarian |
| Minimum | 9.8% | 6.1% |
| Maximum | 100.0% | 100.0% |
| Range | 90.2% | 93.9% |
| Mean | 49.1% | 34.4% |
| Median | 46.0% | 26.4% |
| Interquartile 25% (IQ1) | 32.1% | 22.1% |
| Interquartile 75% (IQ3) | 59.9% | 37.5% |
| Interquartile Range (IQR) | 27.8% | 15.4% |
| Standard Deviation (Sample) | 22.1% | 21.8% |
| Standard Deviation (Population) | 21.6% | 21.6% |
Similar Demographics by Single Mother Poverty
Demographics Similar to Menominee by Single Mother Poverty
In terms of single mother poverty, the demographic groups most similar to Menominee are Pueblo (37.2%, a difference of 0.37%), Dutch West Indian (36.8%, a difference of 0.78%), Creek (36.7%, a difference of 1.0%), Native/Alaskan (36.6%, a difference of 1.2%), and Apache (36.6%, a difference of 1.3%).
| Demographics | Rating | Rank | Single Mother Poverty |
| Seminole | 0.0 /100 | #326 | Tragic 35.8% |
| Yakama | 0.0 /100 | #327 | Tragic 36.4% |
| Choctaw | 0.0 /100 | #328 | Tragic 36.4% |
| Apache | 0.0 /100 | #329 | Tragic 36.6% |
| Natives/Alaskans | 0.0 /100 | #330 | Tragic 36.6% |
| Creek | 0.0 /100 | #331 | Tragic 36.7% |
| Dutch West Indians | 0.0 /100 | #332 | Tragic 36.8% |
| Menominee | 0.0 /100 | #333 | Tragic 37.1% |
| Pueblo | 0.0 /100 | #334 | Tragic 37.2% |
| Yuman | 0.0 /100 | #335 | Tragic 37.8% |
| Cheyenne | 0.0 /100 | #336 | Tragic 38.5% |
| Immigrants | Yemen | 0.0 /100 | #337 | Tragic 38.5% |
| Pima | 0.0 /100 | #338 | Tragic 38.6% |
| Crow | 0.0 /100 | #339 | Tragic 38.6% |
| Sioux | 0.0 /100 | #340 | Tragic 38.8% |
Demographics Similar to Bulgarians by Single Mother Poverty
In terms of single mother poverty, the demographic groups most similar to Bulgarians are Immigrants from Indonesia (26.6%, a difference of 0.010%), Tongan (26.5%, a difference of 0.040%), Maltese (26.6%, a difference of 0.13%), Okinawan (26.6%, a difference of 0.18%), and Immigrants from Israel (26.6%, a difference of 0.18%).
| Demographics | Rating | Rank | Single Mother Poverty |
| Immigrants | Sri Lanka | 100.0 /100 | #26 | Exceptional 26.3% |
| Immigrants | Japan | 100.0 /100 | #27 | Exceptional 26.4% |
| Koreans | 100.0 /100 | #28 | Exceptional 26.4% |
| Jordanians | 100.0 /100 | #29 | Exceptional 26.4% |
| Turks | 100.0 /100 | #30 | Exceptional 26.4% |
| Immigrants | Philippines | 100.0 /100 | #31 | Exceptional 26.5% |
| Tongans | 99.9 /100 | #32 | Exceptional 26.5% |
| Bulgarians | 99.9 /100 | #33 | Exceptional 26.5% |
| Immigrants | Indonesia | 99.9 /100 | #34 | Exceptional 26.6% |
| Maltese | 99.9 /100 | #35 | Exceptional 26.6% |
| Okinawans | 99.9 /100 | #36 | Exceptional 26.6% |
| Immigrants | Israel | 99.9 /100 | #37 | Exceptional 26.6% |
| Immigrants | Fiji | 99.9 /100 | #38 | Exceptional 26.6% |
| Sri Lankans | 99.9 /100 | #39 | Exceptional 26.7% |
| Immigrants | Vietnam | 99.9 /100 | #40 | Exceptional 26.7% |