Menominee vs Australian Single Mother Poverty
COMPARE
Menominee
Australian
Single Mother Poverty
Single Mother Poverty Comparison
Menominee
Australians
37.1%
SINGLE MOTHER POVERTY
0.0/ 100
METRIC RATING
333rd/ 347
METRIC RANK
28.3%
SINGLE MOTHER POVERTY
92.5/ 100
METRIC RATING
117th/ 347
METRIC RANK
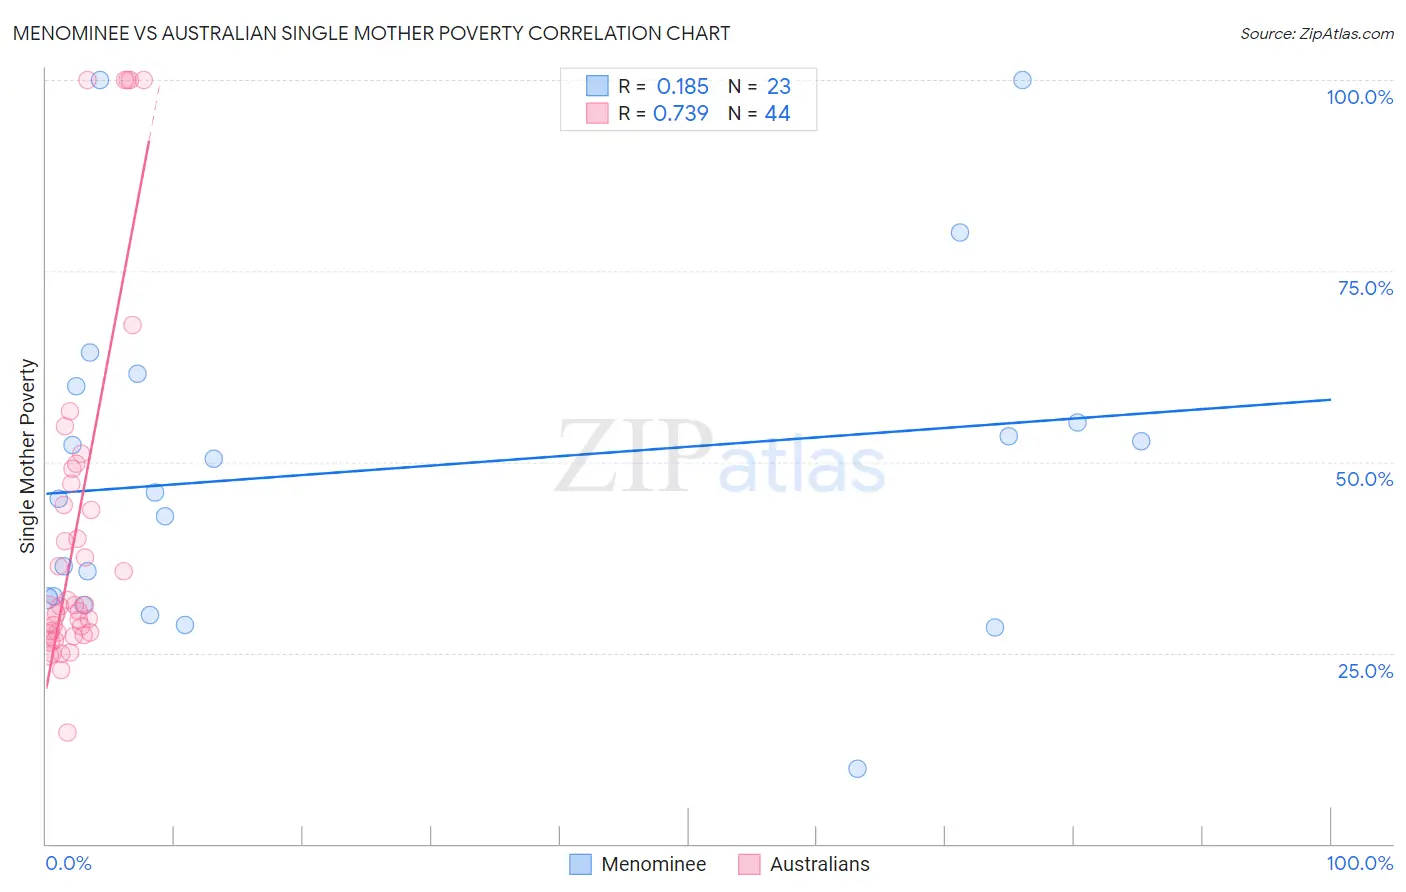
Menominee vs Australian Single Mother Poverty Correlation Chart
The statistical analysis conducted on geographies consisting of 45,498,385 people shows a poor positive correlation between the proportion of Menominee and poverty level among single mothers in the United States with a correlation coefficient (R) of 0.185 and weighted average of 37.1%. Similarly, the statistical analysis conducted on geographies consisting of 220,322,695 people shows a strong positive correlation between the proportion of Australians and poverty level among single mothers in the United States with a correlation coefficient (R) of 0.739 and weighted average of 28.3%, a difference of 31.0%.
Single Mother Poverty Correlation Summary
| Measurement | Menominee | Australian |
| Minimum | 9.8% | 14.5% |
| Maximum | 100.0% | 100.0% |
| Range | 90.2% | 85.5% |
| Mean | 49.1% | 41.8% |
| Median | 46.0% | 31.2% |
| Interquartile 25% (IQ1) | 32.1% | 27.6% |
| Interquartile 75% (IQ3) | 59.9% | 48.1% |
| Interquartile Range (IQR) | 27.8% | 20.5% |
| Standard Deviation (Sample) | 22.1% | 23.5% |
| Standard Deviation (Population) | 21.6% | 23.2% |
Similar Demographics by Single Mother Poverty
Demographics Similar to Menominee by Single Mother Poverty
In terms of single mother poverty, the demographic groups most similar to Menominee are Pueblo (37.2%, a difference of 0.37%), Dutch West Indian (36.8%, a difference of 0.78%), Creek (36.7%, a difference of 1.0%), Native/Alaskan (36.6%, a difference of 1.2%), and Apache (36.6%, a difference of 1.3%).
| Demographics | Rating | Rank | Single Mother Poverty |
| Seminole | 0.0 /100 | #326 | Tragic 35.8% |
| Yakama | 0.0 /100 | #327 | Tragic 36.4% |
| Choctaw | 0.0 /100 | #328 | Tragic 36.4% |
| Apache | 0.0 /100 | #329 | Tragic 36.6% |
| Natives/Alaskans | 0.0 /100 | #330 | Tragic 36.6% |
| Creek | 0.0 /100 | #331 | Tragic 36.7% |
| Dutch West Indians | 0.0 /100 | #332 | Tragic 36.8% |
| Menominee | 0.0 /100 | #333 | Tragic 37.1% |
| Pueblo | 0.0 /100 | #334 | Tragic 37.2% |
| Yuman | 0.0 /100 | #335 | Tragic 37.8% |
| Cheyenne | 0.0 /100 | #336 | Tragic 38.5% |
| Immigrants | Yemen | 0.0 /100 | #337 | Tragic 38.5% |
| Pima | 0.0 /100 | #338 | Tragic 38.6% |
| Crow | 0.0 /100 | #339 | Tragic 38.6% |
| Sioux | 0.0 /100 | #340 | Tragic 38.8% |
Demographics Similar to Australians by Single Mother Poverty
In terms of single mother poverty, the demographic groups most similar to Australians are Immigrants from Uganda (28.3%, a difference of 0.010%), Brazilian (28.3%, a difference of 0.010%), Immigrants from Syria (28.3%, a difference of 0.020%), Immigrants from Kuwait (28.3%, a difference of 0.030%), and Immigrants from Western Asia (28.3%, a difference of 0.040%).
| Demographics | Rating | Rank | Single Mother Poverty |
| Croatians | 94.8 /100 | #110 | Exceptional 28.2% |
| Venezuelans | 94.5 /100 | #111 | Exceptional 28.2% |
| Immigrants | Kazakhstan | 94.5 /100 | #112 | Exceptional 28.2% |
| Immigrants | South Africa | 93.2 /100 | #113 | Exceptional 28.3% |
| Immigrants | Western Asia | 92.7 /100 | #114 | Exceptional 28.3% |
| Immigrants | Kuwait | 92.7 /100 | #115 | Exceptional 28.3% |
| Immigrants | Uganda | 92.5 /100 | #116 | Exceptional 28.3% |
| Australians | 92.5 /100 | #117 | Exceptional 28.3% |
| Brazilians | 92.4 /100 | #118 | Exceptional 28.3% |
| Immigrants | Syria | 92.4 /100 | #119 | Exceptional 28.3% |
| Cypriots | 92.3 /100 | #120 | Exceptional 28.3% |
| Immigrants | Afghanistan | 92.1 /100 | #121 | Exceptional 28.3% |
| Colombians | 91.8 /100 | #122 | Exceptional 28.3% |
| Uruguayans | 91.7 /100 | #123 | Exceptional 28.3% |
| Immigrants | Switzerland | 91.7 /100 | #124 | Exceptional 28.3% |