Menominee vs Immigrants from Venezuela Single Mother Poverty
COMPARE
Menominee
Immigrants from Venezuela
Single Mother Poverty
Single Mother Poverty Comparison
Menominee
Immigrants from Venezuela
37.1%
SINGLE MOTHER POVERTY
0.0/ 100
METRIC RATING
333rd/ 347
METRIC RANK
28.1%
SINGLE MOTHER POVERTY
95.8/ 100
METRIC RATING
107th/ 347
METRIC RANK
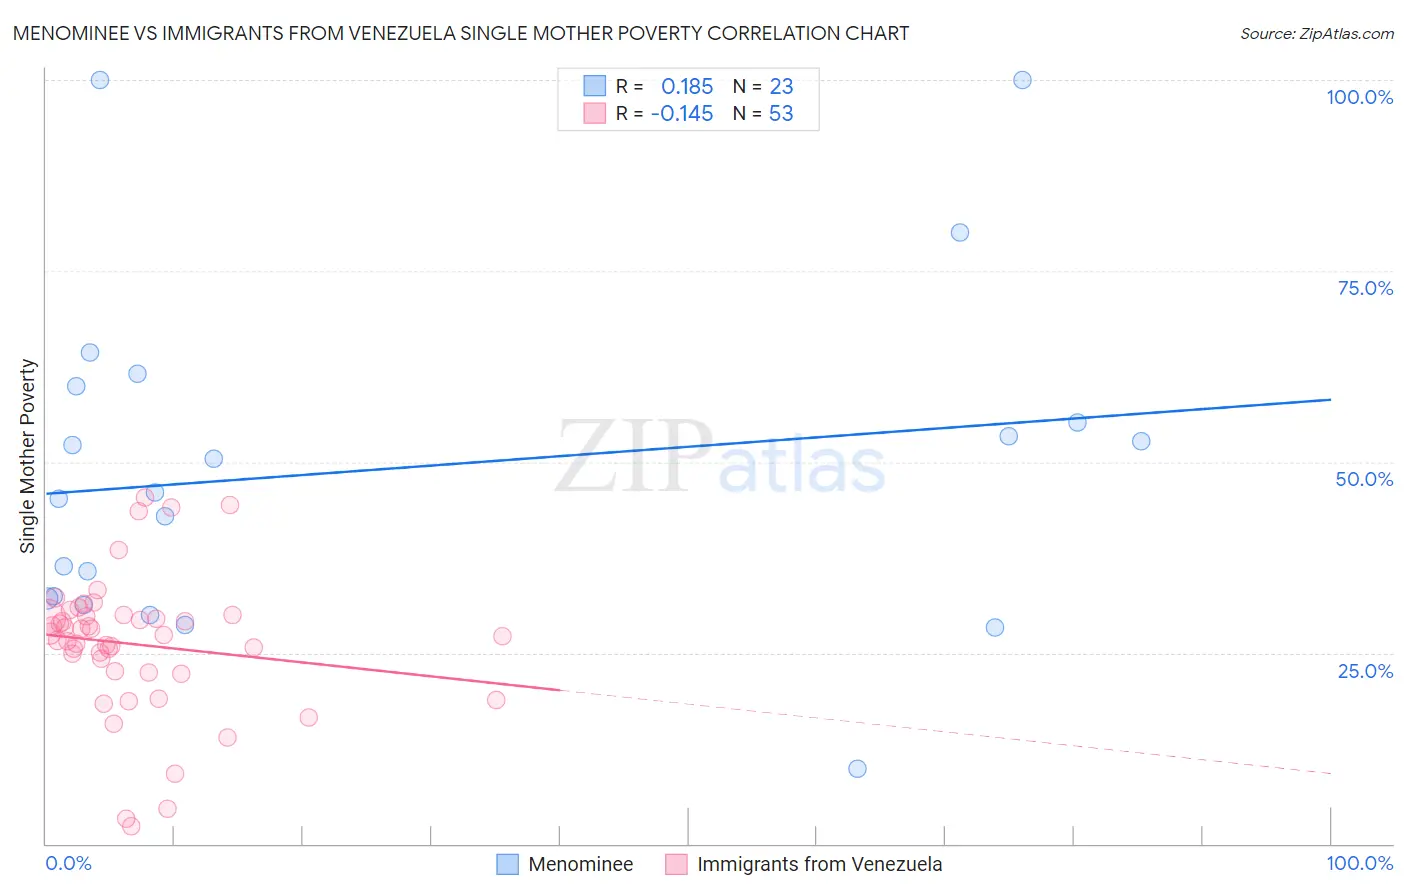
Menominee vs Immigrants from Venezuela Single Mother Poverty Correlation Chart
The statistical analysis conducted on geographies consisting of 45,498,385 people shows a poor positive correlation between the proportion of Menominee and poverty level among single mothers in the United States with a correlation coefficient (R) of 0.185 and weighted average of 37.1%. Similarly, the statistical analysis conducted on geographies consisting of 283,418,306 people shows a poor negative correlation between the proportion of Immigrants from Venezuela and poverty level among single mothers in the United States with a correlation coefficient (R) of -0.145 and weighted average of 28.1%, a difference of 32.0%.
Single Mother Poverty Correlation Summary
| Measurement | Menominee | Immigrants from Venezuela |
| Minimum | 9.8% | 2.4% |
| Maximum | 100.0% | 45.4% |
| Range | 90.2% | 43.0% |
| Mean | 49.1% | 26.1% |
| Median | 46.0% | 27.3% |
| Interquartile 25% (IQ1) | 32.1% | 22.5% |
| Interquartile 75% (IQ3) | 59.9% | 29.9% |
| Interquartile Range (IQR) | 27.8% | 7.4% |
| Standard Deviation (Sample) | 22.1% | 9.0% |
| Standard Deviation (Population) | 21.6% | 9.0% |
Similar Demographics by Single Mother Poverty
Demographics Similar to Menominee by Single Mother Poverty
In terms of single mother poverty, the demographic groups most similar to Menominee are Pueblo (37.2%, a difference of 0.37%), Dutch West Indian (36.8%, a difference of 0.78%), Creek (36.7%, a difference of 1.0%), Native/Alaskan (36.6%, a difference of 1.2%), and Apache (36.6%, a difference of 1.3%).
| Demographics | Rating | Rank | Single Mother Poverty |
| Seminole | 0.0 /100 | #326 | Tragic 35.8% |
| Yakama | 0.0 /100 | #327 | Tragic 36.4% |
| Choctaw | 0.0 /100 | #328 | Tragic 36.4% |
| Apache | 0.0 /100 | #329 | Tragic 36.6% |
| Natives/Alaskans | 0.0 /100 | #330 | Tragic 36.6% |
| Creek | 0.0 /100 | #331 | Tragic 36.7% |
| Dutch West Indians | 0.0 /100 | #332 | Tragic 36.8% |
| Menominee | 0.0 /100 | #333 | Tragic 37.1% |
| Pueblo | 0.0 /100 | #334 | Tragic 37.2% |
| Yuman | 0.0 /100 | #335 | Tragic 37.8% |
| Cheyenne | 0.0 /100 | #336 | Tragic 38.5% |
| Immigrants | Yemen | 0.0 /100 | #337 | Tragic 38.5% |
| Pima | 0.0 /100 | #338 | Tragic 38.6% |
| Crow | 0.0 /100 | #339 | Tragic 38.6% |
| Sioux | 0.0 /100 | #340 | Tragic 38.8% |
Demographics Similar to Immigrants from Venezuela by Single Mother Poverty
In terms of single mother poverty, the demographic groups most similar to Immigrants from Venezuela are Immigrants from Zimbabwe (28.1%, a difference of 0.080%), Immigrants from Armenia (28.1%, a difference of 0.17%), Ukrainian (28.0%, a difference of 0.21%), Israeli (28.0%, a difference of 0.25%), and Italian (28.0%, a difference of 0.28%).
| Demographics | Rating | Rank | Single Mother Poverty |
| Zimbabweans | 97.1 /100 | #100 | Exceptional 27.9% |
| Pakistanis | 96.9 /100 | #101 | Exceptional 28.0% |
| Immigrants | Croatia | 96.7 /100 | #102 | Exceptional 28.0% |
| Immigrants | Northern Africa | 96.6 /100 | #103 | Exceptional 28.0% |
| Italians | 96.6 /100 | #104 | Exceptional 28.0% |
| Israelis | 96.5 /100 | #105 | Exceptional 28.0% |
| Ukrainians | 96.4 /100 | #106 | Exceptional 28.0% |
| Immigrants | Venezuela | 95.8 /100 | #107 | Exceptional 28.1% |
| Immigrants | Zimbabwe | 95.5 /100 | #108 | Exceptional 28.1% |
| Immigrants | Armenia | 95.2 /100 | #109 | Exceptional 28.1% |
| Croatians | 94.8 /100 | #110 | Exceptional 28.2% |
| Venezuelans | 94.5 /100 | #111 | Exceptional 28.2% |
| Immigrants | Kazakhstan | 94.5 /100 | #112 | Exceptional 28.2% |
| Immigrants | South Africa | 93.2 /100 | #113 | Exceptional 28.3% |
| Immigrants | Western Asia | 92.7 /100 | #114 | Exceptional 28.3% |