Chickasaw vs Spaniard Single Father Poverty
COMPARE
Chickasaw
Spaniard
Single Father Poverty
Single Father Poverty Comparison
Chickasaw
Spaniards
19.0%
SINGLE FATHER POVERTY
0.0/ 100
METRIC RATING
315th/ 347
METRIC RANK
17.2%
SINGLE FATHER POVERTY
0.6/ 100
METRIC RATING
260th/ 347
METRIC RANK
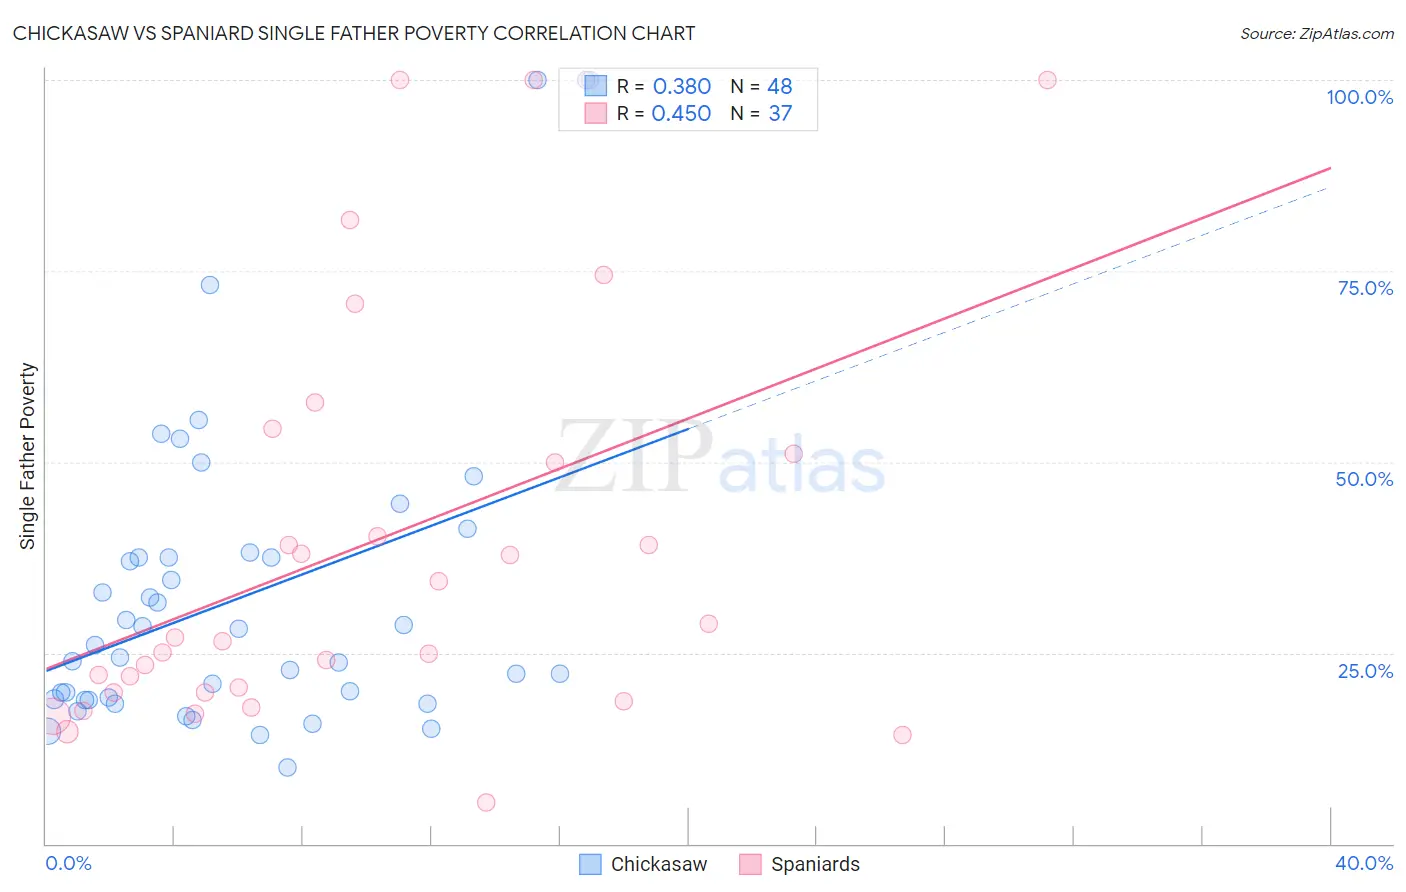
Chickasaw vs Spaniard Single Father Poverty Correlation Chart
The statistical analysis conducted on geographies consisting of 131,493,414 people shows a mild positive correlation between the proportion of Chickasaw and poverty level among single fathers in the United States with a correlation coefficient (R) of 0.380 and weighted average of 19.0%. Similarly, the statistical analysis conducted on geographies consisting of 345,009,065 people shows a moderate positive correlation between the proportion of Spaniards and poverty level among single fathers in the United States with a correlation coefficient (R) of 0.450 and weighted average of 17.2%, a difference of 10.1%.
Single Father Poverty Correlation Summary
| Measurement | Chickasaw | Spaniard |
| Minimum | 10.0% | 5.4% |
| Maximum | 100.0% | 100.0% |
| Range | 90.0% | 94.6% |
| Mean | 31.9% | 39.8% |
| Median | 25.2% | 27.0% |
| Interquartile 25% (IQ1) | 18.9% | 19.8% |
| Interquartile 75% (IQ3) | 37.5% | 52.7% |
| Interquartile Range (IQR) | 18.6% | 32.9% |
| Standard Deviation (Sample) | 19.5% | 27.6% |
| Standard Deviation (Population) | 19.3% | 27.2% |
Similar Demographics by Single Father Poverty
Demographics Similar to Chickasaw by Single Father Poverty
In terms of single father poverty, the demographic groups most similar to Chickasaw are Delaware (18.9%, a difference of 0.16%), Potawatomi (18.9%, a difference of 0.32%), Osage (19.0%, a difference of 0.40%), Immigrants from Dominica (18.9%, a difference of 0.52%), and Nonimmigrants (18.8%, a difference of 0.57%).
| Demographics | Rating | Rank | Single Father Poverty |
| Ottawa | 0.0 /100 | #308 | Tragic 18.6% |
| Immigrants | Micronesia | 0.0 /100 | #309 | Tragic 18.6% |
| Chippewa | 0.0 /100 | #310 | Tragic 18.8% |
| Immigrants | Nonimmigrants | 0.0 /100 | #311 | Tragic 18.8% |
| Immigrants | Dominica | 0.0 /100 | #312 | Tragic 18.9% |
| Potawatomi | 0.0 /100 | #313 | Tragic 18.9% |
| Delaware | 0.0 /100 | #314 | Tragic 18.9% |
| Chickasaw | 0.0 /100 | #315 | Tragic 19.0% |
| Osage | 0.0 /100 | #316 | Tragic 19.0% |
| Dominicans | 0.0 /100 | #317 | Tragic 19.1% |
| Dutch West Indians | 0.0 /100 | #318 | Tragic 19.2% |
| Slovaks | 0.0 /100 | #319 | Tragic 19.3% |
| Inupiat | 0.0 /100 | #320 | Tragic 19.5% |
| Cherokee | 0.0 /100 | #321 | Tragic 19.6% |
| Creek | 0.0 /100 | #322 | Tragic 19.8% |
Demographics Similar to Spaniards by Single Father Poverty
In terms of single father poverty, the demographic groups most similar to Spaniards are Immigrants from Jamaica (17.2%, a difference of 0.15%), Albanian (17.2%, a difference of 0.18%), Immigrants from Albania (17.2%, a difference of 0.20%), Swiss (17.3%, a difference of 0.22%), and Immigrants from Haiti (17.2%, a difference of 0.28%).
| Demographics | Rating | Rank | Single Father Poverty |
| Cree | 1.0 /100 | #253 | Tragic 17.1% |
| Immigrants | Honduras | 0.9 /100 | #254 | Tragic 17.1% |
| Sierra Leoneans | 0.8 /100 | #255 | Tragic 17.2% |
| Immigrants | Haiti | 0.8 /100 | #256 | Tragic 17.2% |
| Immigrants | Albania | 0.7 /100 | #257 | Tragic 17.2% |
| Albanians | 0.7 /100 | #258 | Tragic 17.2% |
| Immigrants | Jamaica | 0.7 /100 | #259 | Tragic 17.2% |
| Spaniards | 0.6 /100 | #260 | Tragic 17.2% |
| Swiss | 0.5 /100 | #261 | Tragic 17.3% |
| Immigrants | Zaire | 0.4 /100 | #262 | Tragic 17.3% |
| Lithuanians | 0.4 /100 | #263 | Tragic 17.3% |
| Slovenes | 0.3 /100 | #264 | Tragic 17.3% |
| Poles | 0.3 /100 | #265 | Tragic 17.3% |
| Jamaicans | 0.3 /100 | #266 | Tragic 17.3% |
| Haitians | 0.3 /100 | #267 | Tragic 17.3% |