Malaysian vs Yup'ik Single Male Poverty
COMPARE
Malaysian
Yup'ik
Single Male Poverty
Single Male Poverty Comparison
Malaysians
Yup'ik
12.6%
SINGLE MALE POVERTY
74.8/ 100
METRIC RATING
147th/ 347
METRIC RANK
31.6%
SINGLE MALE POVERTY
0.0/ 100
METRIC RATING
347th/ 347
METRIC RANK
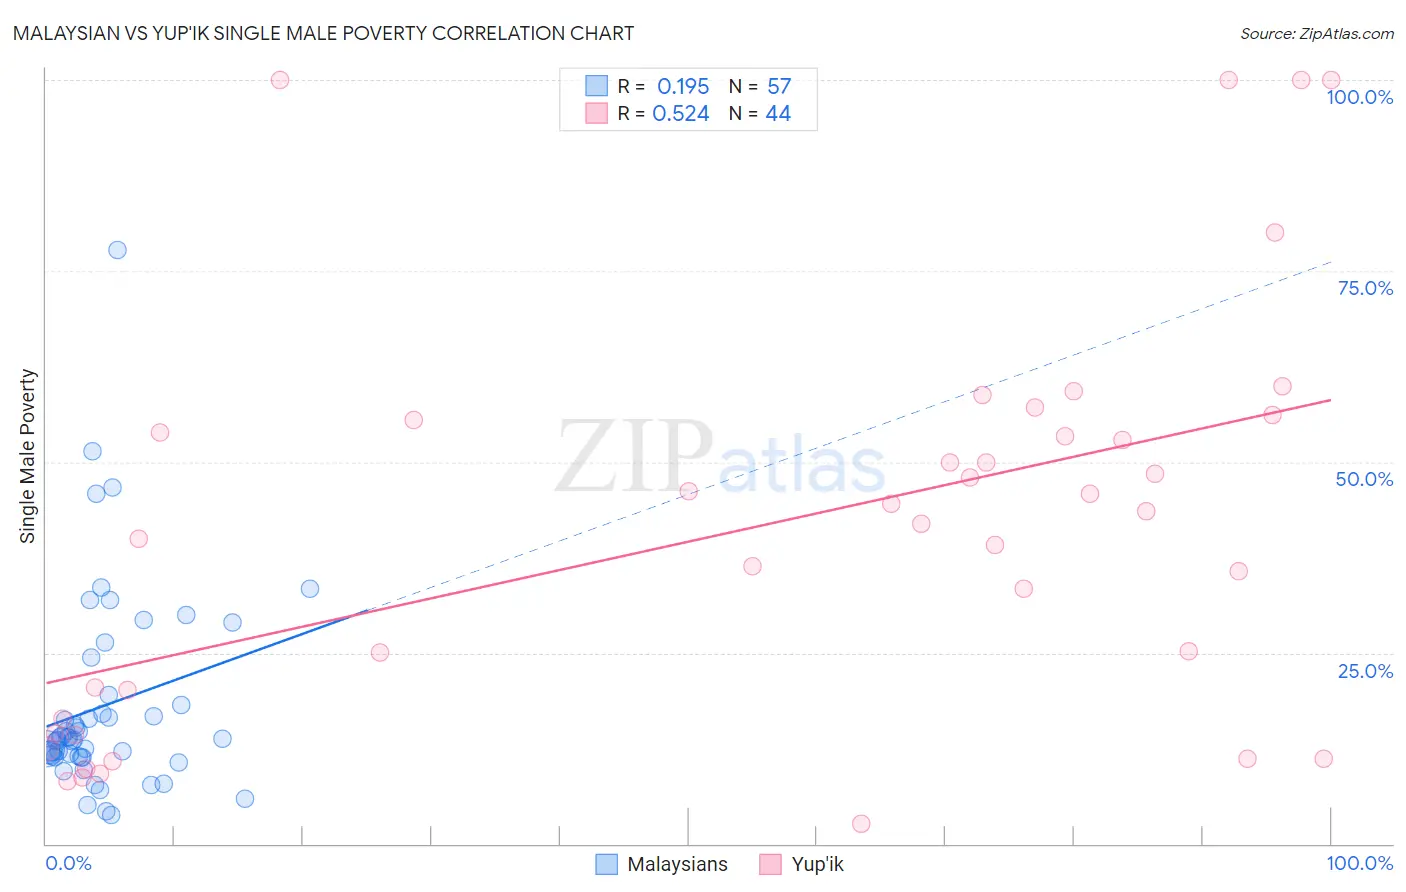
Malaysian vs Yup'ik Single Male Poverty Correlation Chart
The statistical analysis conducted on geographies consisting of 211,653,491 people shows a poor positive correlation between the proportion of Malaysians and poverty level among single males in the United States with a correlation coefficient (R) of 0.195 and weighted average of 12.6%. Similarly, the statistical analysis conducted on geographies consisting of 38,853,365 people shows a substantial positive correlation between the proportion of Yup'ik and poverty level among single males in the United States with a correlation coefficient (R) of 0.524 and weighted average of 31.6%, a difference of 150.7%.
Single Male Poverty Correlation Summary
| Measurement | Malaysian | Yup'ik |
| Minimum | 3.8% | 2.6% |
| Maximum | 77.8% | 100.0% |
| Range | 74.0% | 97.4% |
| Mean | 18.1% | 41.1% |
| Median | 13.8% | 42.7% |
| Interquartile 25% (IQ1) | 11.4% | 15.4% |
| Interquartile 75% (IQ3) | 18.8% | 54.7% |
| Interquartile Range (IQR) | 7.5% | 39.3% |
| Standard Deviation (Sample) | 13.2% | 26.6% |
| Standard Deviation (Population) | 13.0% | 26.3% |
Similar Demographics by Single Male Poverty
Demographics Similar to Malaysians by Single Male Poverty
In terms of single male poverty, the demographic groups most similar to Malaysians are Immigrants from Lebanon (12.6%, a difference of 0.010%), Native Hawaiian (12.6%, a difference of 0.010%), Hawaiian (12.6%, a difference of 0.020%), Yugoslavian (12.6%, a difference of 0.060%), and Immigrants from France (12.6%, a difference of 0.070%).
| Demographics | Rating | Rank | Single Male Poverty |
| Immigrants | Zimbabwe | 78.0 /100 | #140 | Good 12.6% |
| Okinawans | 75.9 /100 | #141 | Good 12.6% |
| Immigrants | Uganda | 75.9 /100 | #142 | Good 12.6% |
| Immigrants | France | 75.8 /100 | #143 | Good 12.6% |
| Hawaiians | 75.1 /100 | #144 | Good 12.6% |
| Immigrants | Lebanon | 75.0 /100 | #145 | Good 12.6% |
| Native Hawaiians | 75.0 /100 | #146 | Good 12.6% |
| Malaysians | 74.8 /100 | #147 | Good 12.6% |
| Yugoslavians | 73.9 /100 | #148 | Good 12.6% |
| Sierra Leoneans | 73.0 /100 | #149 | Good 12.6% |
| Immigrants | Panama | 72.1 /100 | #150 | Good 12.6% |
| Immigrants | Hungary | 71.9 /100 | #151 | Good 12.6% |
| Australians | 71.4 /100 | #152 | Good 12.6% |
| Immigrants | Immigrants | 70.1 /100 | #153 | Good 12.7% |
| Immigrants | Scotland | 68.9 /100 | #154 | Good 12.7% |
Demographics Similar to Yup'ik by Single Male Poverty
In terms of single male poverty, the demographic groups most similar to Yup'ik are Hopi (27.5%, a difference of 15.0%), Navajo (25.3%, a difference of 24.8%), Lumbee (25.2%, a difference of 25.7%), Puerto Rican (25.1%, a difference of 26.1%), and Houma (23.5%, a difference of 34.9%).
| Demographics | Rating | Rank | Single Male Poverty |
| Inupiat | 0.0 /100 | #333 | Tragic 20.0% |
| Pima | 0.0 /100 | #334 | Tragic 20.2% |
| Yuman | 0.0 /100 | #335 | Tragic 21.3% |
| Tohono O'odham | 0.0 /100 | #336 | Tragic 21.6% |
| Apache | 0.0 /100 | #337 | Tragic 21.6% |
| Pueblo | 0.0 /100 | #338 | Tragic 21.6% |
| Arapaho | 0.0 /100 | #339 | Tragic 21.9% |
| Sioux | 0.0 /100 | #340 | Tragic 22.2% |
| Crow | 0.0 /100 | #341 | Tragic 23.3% |
| Houma | 0.0 /100 | #342 | Tragic 23.5% |
| Puerto Ricans | 0.0 /100 | #343 | Tragic 25.1% |
| Lumbee | 0.0 /100 | #344 | Tragic 25.2% |
| Navajo | 0.0 /100 | #345 | Tragic 25.3% |
| Hopi | 0.0 /100 | #346 | Tragic 27.5% |
| Yup'ik | 0.0 /100 | #347 | Tragic 31.6% |