Immigrants from Sudan vs Yup'ik Single Male Poverty
COMPARE
Immigrants from Sudan
Yup'ik
Single Male Poverty
Single Male Poverty Comparison
Immigrants from Sudan
Yup'ik
12.7%
SINGLE MALE POVERTY
58.2/ 100
METRIC RATING
167th/ 347
METRIC RANK
31.6%
SINGLE MALE POVERTY
0.0/ 100
METRIC RATING
347th/ 347
METRIC RANK
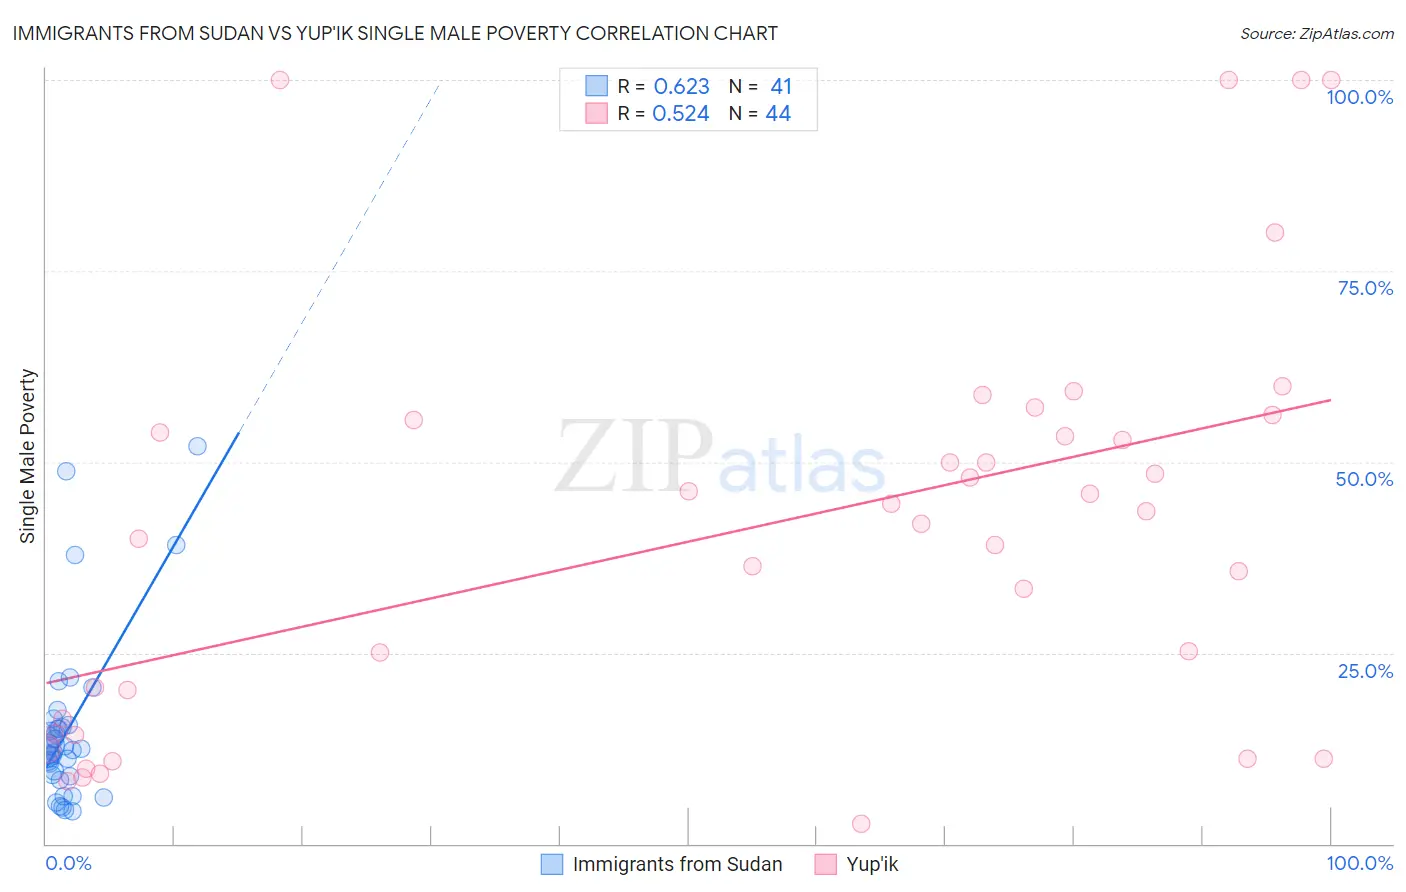
Immigrants from Sudan vs Yup'ik Single Male Poverty Correlation Chart
The statistical analysis conducted on geographies consisting of 114,680,115 people shows a significant positive correlation between the proportion of Immigrants from Sudan and poverty level among single males in the United States with a correlation coefficient (R) of 0.623 and weighted average of 12.7%. Similarly, the statistical analysis conducted on geographies consisting of 38,853,365 people shows a substantial positive correlation between the proportion of Yup'ik and poverty level among single males in the United States with a correlation coefficient (R) of 0.524 and weighted average of 31.6%, a difference of 148.2%.
Single Male Poverty Correlation Summary
| Measurement | Immigrants from Sudan | Yup'ik |
| Minimum | 4.2% | 2.6% |
| Maximum | 52.0% | 100.0% |
| Range | 47.8% | 97.4% |
| Mean | 14.9% | 41.1% |
| Median | 12.5% | 42.7% |
| Interquartile 25% (IQ1) | 8.9% | 15.4% |
| Interquartile 75% (IQ3) | 15.4% | 54.7% |
| Interquartile Range (IQR) | 6.5% | 39.3% |
| Standard Deviation (Sample) | 10.9% | 26.6% |
| Standard Deviation (Population) | 10.8% | 26.3% |
Similar Demographics by Single Male Poverty
Demographics Similar to Immigrants from Sudan by Single Male Poverty
In terms of single male poverty, the demographic groups most similar to Immigrants from Sudan are Immigrants from Barbados (12.7%, a difference of 0.030%), Immigrants from Guyana (12.7%, a difference of 0.13%), Puget Sound Salish (12.8%, a difference of 0.21%), Immigrants from Cambodia (12.7%, a difference of 0.22%), and Immigrants from Nigeria (12.7%, a difference of 0.26%).
| Demographics | Rating | Rank | Single Male Poverty |
| Greeks | 64.1 /100 | #160 | Good 12.7% |
| Immigrants | Africa | 63.4 /100 | #161 | Good 12.7% |
| Eastern Europeans | 63.3 /100 | #162 | Good 12.7% |
| Palestinians | 63.1 /100 | #163 | Good 12.7% |
| Immigrants | Nigeria | 62.8 /100 | #164 | Good 12.7% |
| Immigrants | Cambodia | 62.2 /100 | #165 | Good 12.7% |
| Immigrants | Guyana | 60.5 /100 | #166 | Good 12.7% |
| Immigrants | Sudan | 58.2 /100 | #167 | Average 12.7% |
| Immigrants | Barbados | 57.7 /100 | #168 | Average 12.7% |
| Puget Sound Salish | 54.3 /100 | #169 | Average 12.8% |
| Guyanese | 52.0 /100 | #170 | Average 12.8% |
| South Africans | 51.5 /100 | #171 | Average 12.8% |
| Danes | 51.4 /100 | #172 | Average 12.8% |
| Immigrants | St. Vincent and the Grenadines | 50.9 /100 | #173 | Average 12.8% |
| Costa Ricans | 50.0 /100 | #174 | Average 12.8% |
Demographics Similar to Yup'ik by Single Male Poverty
In terms of single male poverty, the demographic groups most similar to Yup'ik are Hopi (27.5%, a difference of 15.0%), Navajo (25.3%, a difference of 24.8%), Lumbee (25.2%, a difference of 25.7%), Puerto Rican (25.1%, a difference of 26.1%), and Houma (23.5%, a difference of 34.9%).
| Demographics | Rating | Rank | Single Male Poverty |
| Inupiat | 0.0 /100 | #333 | Tragic 20.0% |
| Pima | 0.0 /100 | #334 | Tragic 20.2% |
| Yuman | 0.0 /100 | #335 | Tragic 21.3% |
| Tohono O'odham | 0.0 /100 | #336 | Tragic 21.6% |
| Apache | 0.0 /100 | #337 | Tragic 21.6% |
| Pueblo | 0.0 /100 | #338 | Tragic 21.6% |
| Arapaho | 0.0 /100 | #339 | Tragic 21.9% |
| Sioux | 0.0 /100 | #340 | Tragic 22.2% |
| Crow | 0.0 /100 | #341 | Tragic 23.3% |
| Houma | 0.0 /100 | #342 | Tragic 23.5% |
| Puerto Ricans | 0.0 /100 | #343 | Tragic 25.1% |
| Lumbee | 0.0 /100 | #344 | Tragic 25.2% |
| Navajo | 0.0 /100 | #345 | Tragic 25.3% |
| Hopi | 0.0 /100 | #346 | Tragic 27.5% |
| Yup'ik | 0.0 /100 | #347 | Tragic 31.6% |