Malaysian vs Immigrants from Ecuador Single Male Poverty
COMPARE
Malaysian
Immigrants from Ecuador
Single Male Poverty
Single Male Poverty Comparison
Malaysians
Immigrants from Ecuador
12.6%
SINGLE MALE POVERTY
74.8/ 100
METRIC RATING
147th/ 347
METRIC RANK
12.5%
SINGLE MALE POVERTY
82.1/ 100
METRIC RATING
134th/ 347
METRIC RANK
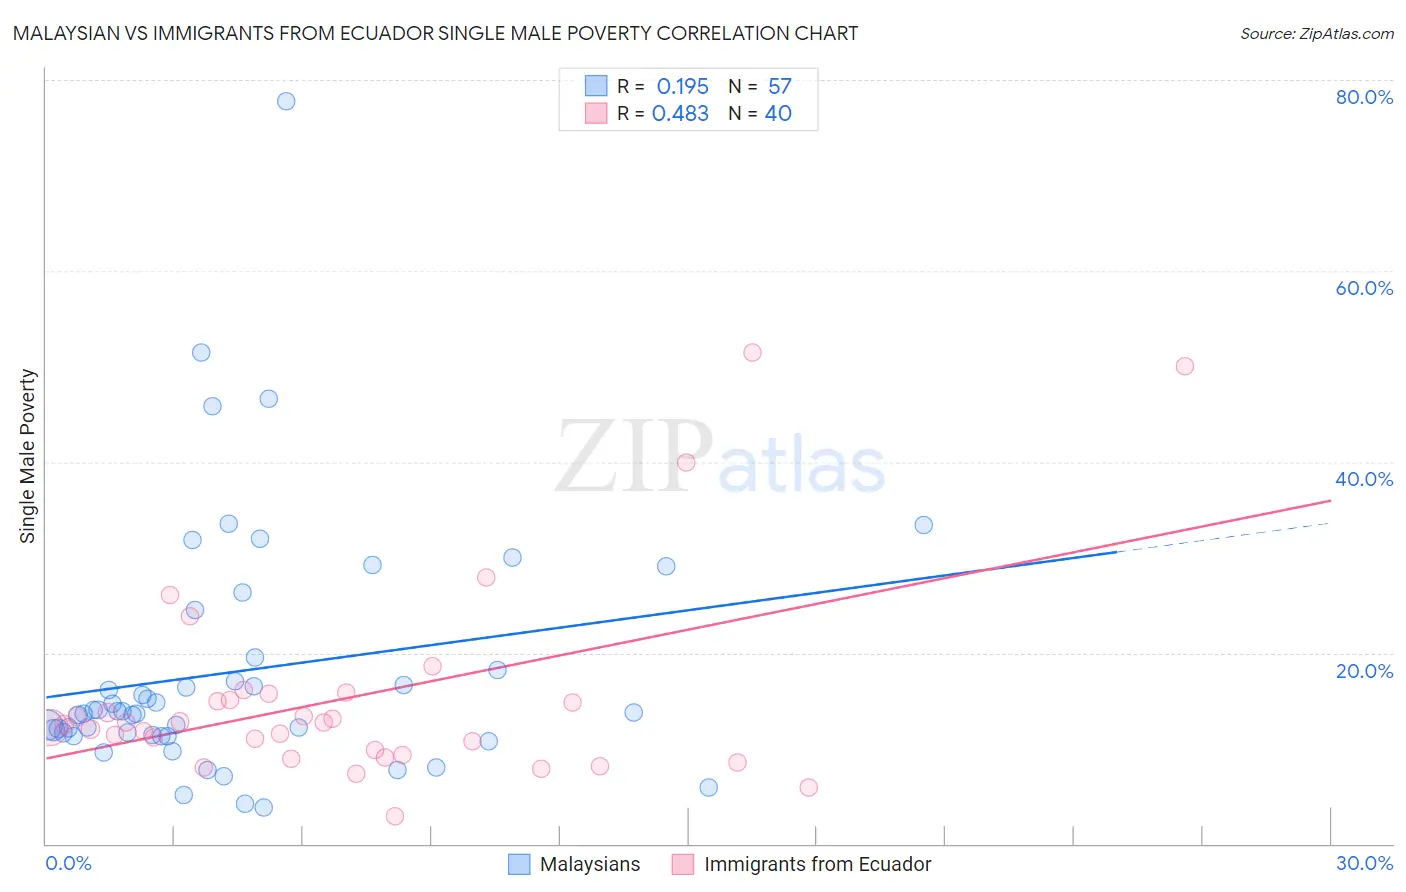
Malaysian vs Immigrants from Ecuador Single Male Poverty Correlation Chart
The statistical analysis conducted on geographies consisting of 211,653,491 people shows a poor positive correlation between the proportion of Malaysians and poverty level among single males in the United States with a correlation coefficient (R) of 0.195 and weighted average of 12.6%. Similarly, the statistical analysis conducted on geographies consisting of 246,565,300 people shows a moderate positive correlation between the proportion of Immigrants from Ecuador and poverty level among single males in the United States with a correlation coefficient (R) of 0.483 and weighted average of 12.5%, a difference of 0.58%.
Single Male Poverty Correlation Summary
| Measurement | Malaysian | Immigrants from Ecuador |
| Minimum | 3.8% | 2.9% |
| Maximum | 77.8% | 51.4% |
| Range | 74.0% | 48.6% |
| Mean | 18.1% | 15.3% |
| Median | 13.8% | 12.6% |
| Interquartile 25% (IQ1) | 11.4% | 9.5% |
| Interquartile 75% (IQ3) | 18.8% | 15.4% |
| Interquartile Range (IQR) | 7.5% | 5.9% |
| Standard Deviation (Sample) | 13.2% | 10.5% |
| Standard Deviation (Population) | 13.0% | 10.4% |
Demographics Similar to Malaysians and Immigrants from Ecuador by Single Male Poverty
In terms of single male poverty, the demographic groups most similar to Malaysians are Immigrants from Lebanon (12.6%, a difference of 0.010%), Native Hawaiian (12.6%, a difference of 0.010%), Hawaiian (12.6%, a difference of 0.020%), Yugoslavian (12.6%, a difference of 0.060%), and Immigrants from France (12.6%, a difference of 0.070%). Similarly, the demographic groups most similar to Immigrants from Ecuador are Immigrants from Costa Rica (12.5%, a difference of 0.010%), Immigrants from Austria (12.5%, a difference of 0.010%), Immigrants from Western Asia (12.5%, a difference of 0.12%), Ukrainian (12.6%, a difference of 0.12%), and Immigrants from Northern Europe (12.5%, a difference of 0.15%).
| Demographics | Rating | Rank | Single Male Poverty |
| Immigrants | Nicaragua | 84.8 /100 | #130 | Excellent 12.5% |
| Immigrants | Northern Europe | 83.7 /100 | #131 | Excellent 12.5% |
| Salvadorans | 83.7 /100 | #132 | Excellent 12.5% |
| Immigrants | Western Asia | 83.4 /100 | #133 | Excellent 12.5% |
| Immigrants | Ecuador | 82.1 /100 | #134 | Excellent 12.5% |
| Immigrants | Costa Rica | 81.9 /100 | #135 | Excellent 12.5% |
| Immigrants | Austria | 81.9 /100 | #136 | Excellent 12.5% |
| Ukrainians | 80.7 /100 | #137 | Excellent 12.6% |
| Immigrants | El Salvador | 80.0 /100 | #138 | Excellent 12.6% |
| Cubans | 79.9 /100 | #139 | Good 12.6% |
| Immigrants | Zimbabwe | 78.0 /100 | #140 | Good 12.6% |
| Okinawans | 75.9 /100 | #141 | Good 12.6% |
| Immigrants | Uganda | 75.9 /100 | #142 | Good 12.6% |
| Immigrants | France | 75.8 /100 | #143 | Good 12.6% |
| Hawaiians | 75.1 /100 | #144 | Good 12.6% |
| Immigrants | Lebanon | 75.0 /100 | #145 | Good 12.6% |
| Native Hawaiians | 75.0 /100 | #146 | Good 12.6% |
| Malaysians | 74.8 /100 | #147 | Good 12.6% |
| Yugoslavians | 73.9 /100 | #148 | Good 12.6% |
| Sierra Leoneans | 73.0 /100 | #149 | Good 12.6% |
| Immigrants | Panama | 72.1 /100 | #150 | Good 12.6% |