Malaysian vs Tohono O'odham Single Male Poverty
COMPARE
Malaysian
Tohono O'odham
Single Male Poverty
Single Male Poverty Comparison
Malaysians
Tohono O'odham
12.6%
SINGLE MALE POVERTY
74.8/ 100
METRIC RATING
147th/ 347
METRIC RANK
21.6%
SINGLE MALE POVERTY
0.0/ 100
METRIC RATING
336th/ 347
METRIC RANK
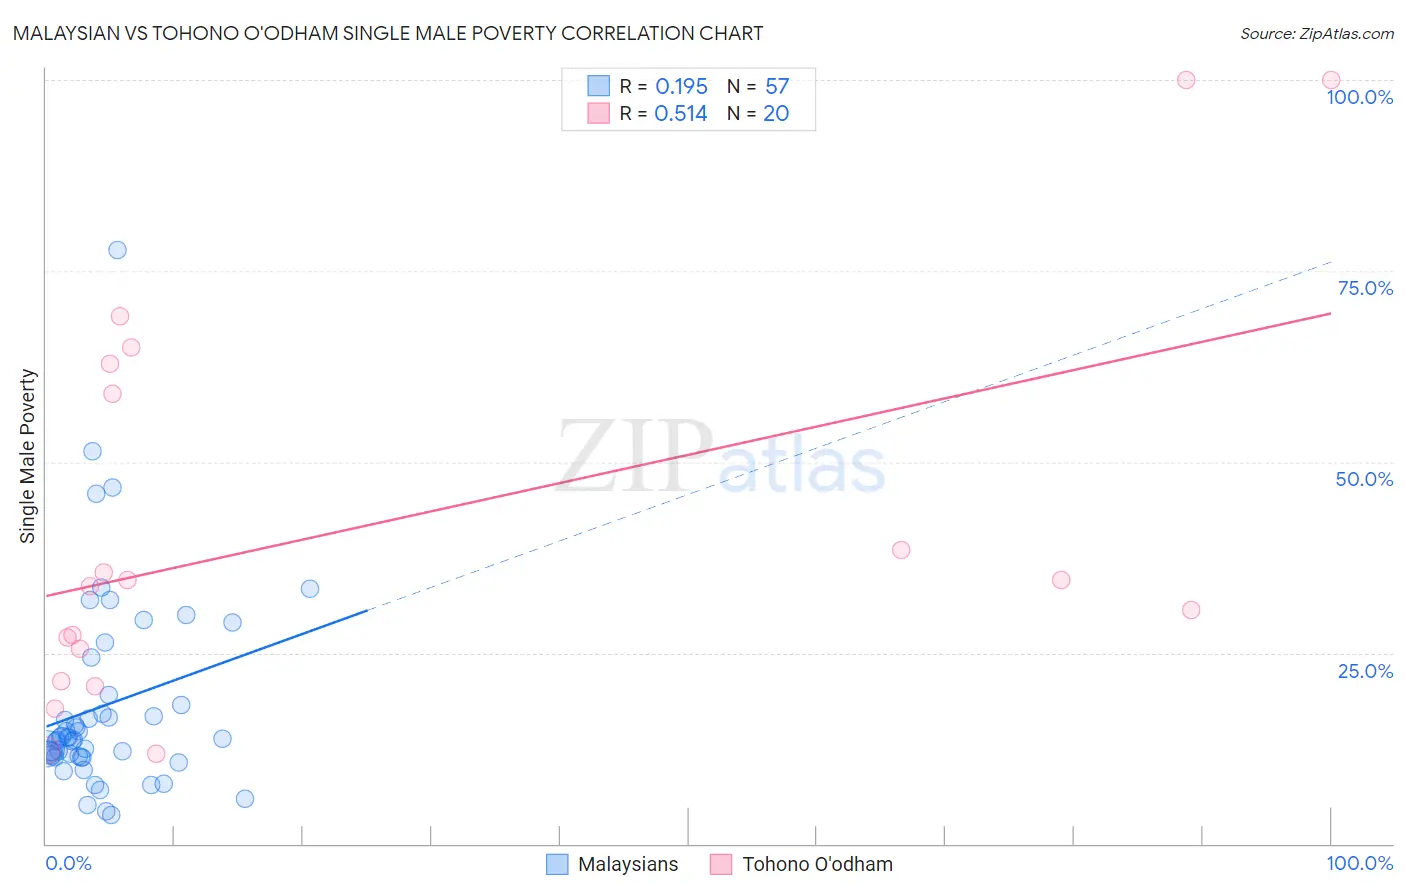
Malaysian vs Tohono O'odham Single Male Poverty Correlation Chart
The statistical analysis conducted on geographies consisting of 211,653,491 people shows a poor positive correlation between the proportion of Malaysians and poverty level among single males in the United States with a correlation coefficient (R) of 0.195 and weighted average of 12.6%. Similarly, the statistical analysis conducted on geographies consisting of 57,748,235 people shows a substantial positive correlation between the proportion of Tohono O'odham and poverty level among single males in the United States with a correlation coefficient (R) of 0.514 and weighted average of 21.6%, a difference of 70.8%.
Single Male Poverty Correlation Summary
| Measurement | Malaysian | Tohono O'odham |
| Minimum | 3.8% | 11.9% |
| Maximum | 77.8% | 100.0% |
| Range | 74.0% | 88.1% |
| Mean | 18.1% | 41.3% |
| Median | 13.8% | 34.1% |
| Interquartile 25% (IQ1) | 11.4% | 23.4% |
| Interquartile 75% (IQ3) | 18.8% | 60.9% |
| Interquartile Range (IQR) | 7.5% | 37.5% |
| Standard Deviation (Sample) | 13.2% | 26.2% |
| Standard Deviation (Population) | 13.0% | 25.6% |
Similar Demographics by Single Male Poverty
Demographics Similar to Malaysians by Single Male Poverty
In terms of single male poverty, the demographic groups most similar to Malaysians are Immigrants from Lebanon (12.6%, a difference of 0.010%), Native Hawaiian (12.6%, a difference of 0.010%), Hawaiian (12.6%, a difference of 0.020%), Yugoslavian (12.6%, a difference of 0.060%), and Immigrants from France (12.6%, a difference of 0.070%).
| Demographics | Rating | Rank | Single Male Poverty |
| Immigrants | Zimbabwe | 78.0 /100 | #140 | Good 12.6% |
| Okinawans | 75.9 /100 | #141 | Good 12.6% |
| Immigrants | Uganda | 75.9 /100 | #142 | Good 12.6% |
| Immigrants | France | 75.8 /100 | #143 | Good 12.6% |
| Hawaiians | 75.1 /100 | #144 | Good 12.6% |
| Immigrants | Lebanon | 75.0 /100 | #145 | Good 12.6% |
| Native Hawaiians | 75.0 /100 | #146 | Good 12.6% |
| Malaysians | 74.8 /100 | #147 | Good 12.6% |
| Yugoslavians | 73.9 /100 | #148 | Good 12.6% |
| Sierra Leoneans | 73.0 /100 | #149 | Good 12.6% |
| Immigrants | Panama | 72.1 /100 | #150 | Good 12.6% |
| Immigrants | Hungary | 71.9 /100 | #151 | Good 12.6% |
| Australians | 71.4 /100 | #152 | Good 12.6% |
| Immigrants | Immigrants | 70.1 /100 | #153 | Good 12.7% |
| Immigrants | Scotland | 68.9 /100 | #154 | Good 12.7% |
Demographics Similar to Tohono O'odham by Single Male Poverty
In terms of single male poverty, the demographic groups most similar to Tohono O'odham are Apache (21.6%, a difference of 0.10%), Pueblo (21.6%, a difference of 0.28%), Yuman (21.3%, a difference of 1.2%), Arapaho (21.9%, a difference of 1.8%), and Sioux (22.2%, a difference of 3.1%).
| Demographics | Rating | Rank | Single Male Poverty |
| Colville | 0.0 /100 | #329 | Tragic 18.4% |
| Cajuns | 0.0 /100 | #330 | Tragic 19.1% |
| Paiute | 0.0 /100 | #331 | Tragic 19.3% |
| Natives/Alaskans | 0.0 /100 | #332 | Tragic 19.6% |
| Inupiat | 0.0 /100 | #333 | Tragic 20.0% |
| Pima | 0.0 /100 | #334 | Tragic 20.2% |
| Yuman | 0.0 /100 | #335 | Tragic 21.3% |
| Tohono O'odham | 0.0 /100 | #336 | Tragic 21.6% |
| Apache | 0.0 /100 | #337 | Tragic 21.6% |
| Pueblo | 0.0 /100 | #338 | Tragic 21.6% |
| Arapaho | 0.0 /100 | #339 | Tragic 21.9% |
| Sioux | 0.0 /100 | #340 | Tragic 22.2% |
| Crow | 0.0 /100 | #341 | Tragic 23.3% |
| Houma | 0.0 /100 | #342 | Tragic 23.5% |
| Puerto Ricans | 0.0 /100 | #343 | Tragic 25.1% |