Malaysian vs Portuguese Single Male Poverty
COMPARE
Malaysian
Portuguese
Single Male Poverty
Single Male Poverty Comparison
Malaysians
Portuguese
12.6%
SINGLE MALE POVERTY
74.8/ 100
METRIC RATING
147th/ 347
METRIC RANK
12.9%
SINGLE MALE POVERTY
30.2/ 100
METRIC RATING
189th/ 347
METRIC RANK
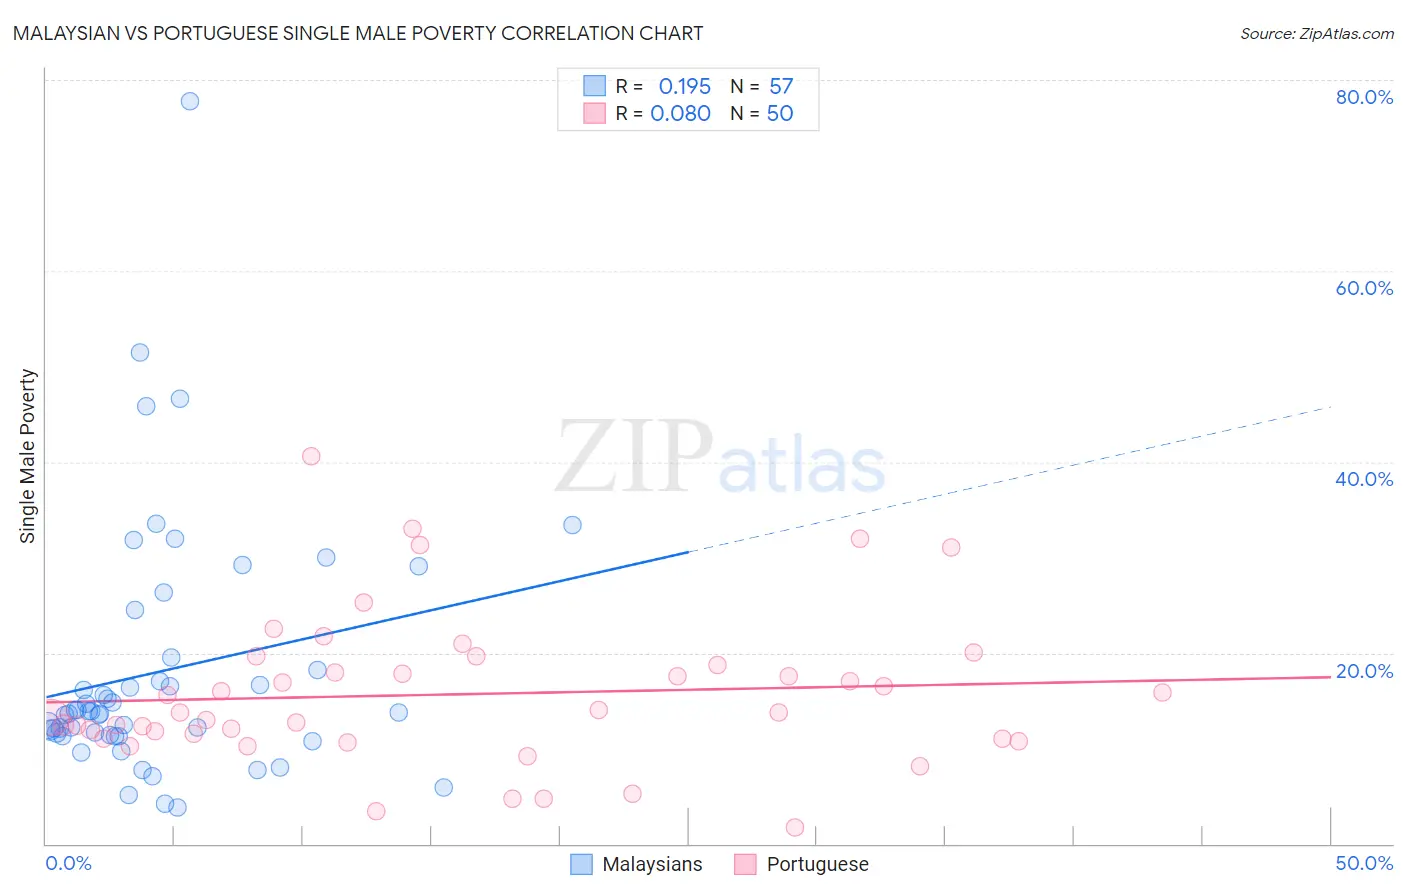
Malaysian vs Portuguese Single Male Poverty Correlation Chart
The statistical analysis conducted on geographies consisting of 211,653,491 people shows a poor positive correlation between the proportion of Malaysians and poverty level among single males in the United States with a correlation coefficient (R) of 0.195 and weighted average of 12.6%. Similarly, the statistical analysis conducted on geographies consisting of 390,984,789 people shows a slight positive correlation between the proportion of Portuguese and poverty level among single males in the United States with a correlation coefficient (R) of 0.080 and weighted average of 12.9%, a difference of 2.6%.
Single Male Poverty Correlation Summary
| Measurement | Malaysian | Portuguese |
| Minimum | 3.8% | 1.7% |
| Maximum | 77.8% | 40.6% |
| Range | 74.0% | 38.8% |
| Mean | 18.1% | 15.7% |
| Median | 13.8% | 13.7% |
| Interquartile 25% (IQ1) | 11.4% | 11.0% |
| Interquartile 75% (IQ3) | 18.8% | 18.7% |
| Interquartile Range (IQR) | 7.5% | 7.7% |
| Standard Deviation (Sample) | 13.2% | 7.9% |
| Standard Deviation (Population) | 13.0% | 7.8% |
Similar Demographics by Single Male Poverty
Demographics Similar to Malaysians by Single Male Poverty
In terms of single male poverty, the demographic groups most similar to Malaysians are Immigrants from Lebanon (12.6%, a difference of 0.010%), Native Hawaiian (12.6%, a difference of 0.010%), Hawaiian (12.6%, a difference of 0.020%), Yugoslavian (12.6%, a difference of 0.060%), and Immigrants from France (12.6%, a difference of 0.070%).
| Demographics | Rating | Rank | Single Male Poverty |
| Immigrants | Zimbabwe | 78.0 /100 | #140 | Good 12.6% |
| Okinawans | 75.9 /100 | #141 | Good 12.6% |
| Immigrants | Uganda | 75.9 /100 | #142 | Good 12.6% |
| Immigrants | France | 75.8 /100 | #143 | Good 12.6% |
| Hawaiians | 75.1 /100 | #144 | Good 12.6% |
| Immigrants | Lebanon | 75.0 /100 | #145 | Good 12.6% |
| Native Hawaiians | 75.0 /100 | #146 | Good 12.6% |
| Malaysians | 74.8 /100 | #147 | Good 12.6% |
| Yugoslavians | 73.9 /100 | #148 | Good 12.6% |
| Sierra Leoneans | 73.0 /100 | #149 | Good 12.6% |
| Immigrants | Panama | 72.1 /100 | #150 | Good 12.6% |
| Immigrants | Hungary | 71.9 /100 | #151 | Good 12.6% |
| Australians | 71.4 /100 | #152 | Good 12.6% |
| Immigrants | Immigrants | 70.1 /100 | #153 | Good 12.7% |
| Immigrants | Scotland | 68.9 /100 | #154 | Good 12.7% |
Demographics Similar to Portuguese by Single Male Poverty
In terms of single male poverty, the demographic groups most similar to Portuguese are Macedonian (12.9%, a difference of 0.080%), Nigerian (12.9%, a difference of 0.10%), Immigrants from Kuwait (12.9%, a difference of 0.10%), Norwegian (12.9%, a difference of 0.11%), and Immigrants from Trinidad and Tobago (12.9%, a difference of 0.14%).
| Demographics | Rating | Rank | Single Male Poverty |
| Moroccans | 36.8 /100 | #182 | Fair 12.9% |
| Immigrants | West Indies | 33.0 /100 | #183 | Fair 12.9% |
| Immigrants | Trinidad and Tobago | 32.5 /100 | #184 | Fair 12.9% |
| Norwegians | 32.0 /100 | #185 | Fair 12.9% |
| Nigerians | 31.9 /100 | #186 | Fair 12.9% |
| Immigrants | Kuwait | 31.9 /100 | #187 | Fair 12.9% |
| Macedonians | 31.5 /100 | #188 | Fair 12.9% |
| Portuguese | 30.2 /100 | #189 | Fair 12.9% |
| Arabs | 27.0 /100 | #190 | Fair 13.0% |
| Immigrants | Thailand | 26.6 /100 | #191 | Fair 13.0% |
| Immigrants | Jamaica | 26.5 /100 | #192 | Fair 13.0% |
| Immigrants | South Africa | 26.1 /100 | #193 | Fair 13.0% |
| Liberians | 25.2 /100 | #194 | Fair 13.0% |
| Immigrants | England | 23.4 /100 | #195 | Fair 13.0% |
| Immigrants | Grenada | 23.1 /100 | #196 | Fair 13.0% |