Jamaican vs Yup'ik Single Male Poverty
COMPARE
Jamaican
Yup'ik
Single Male Poverty
Single Male Poverty Comparison
Jamaicans
Yup'ik
13.2%
SINGLE MALE POVERTY
7.7/ 100
METRIC RATING
226th/ 347
METRIC RANK
31.6%
SINGLE MALE POVERTY
0.0/ 100
METRIC RATING
347th/ 347
METRIC RANK
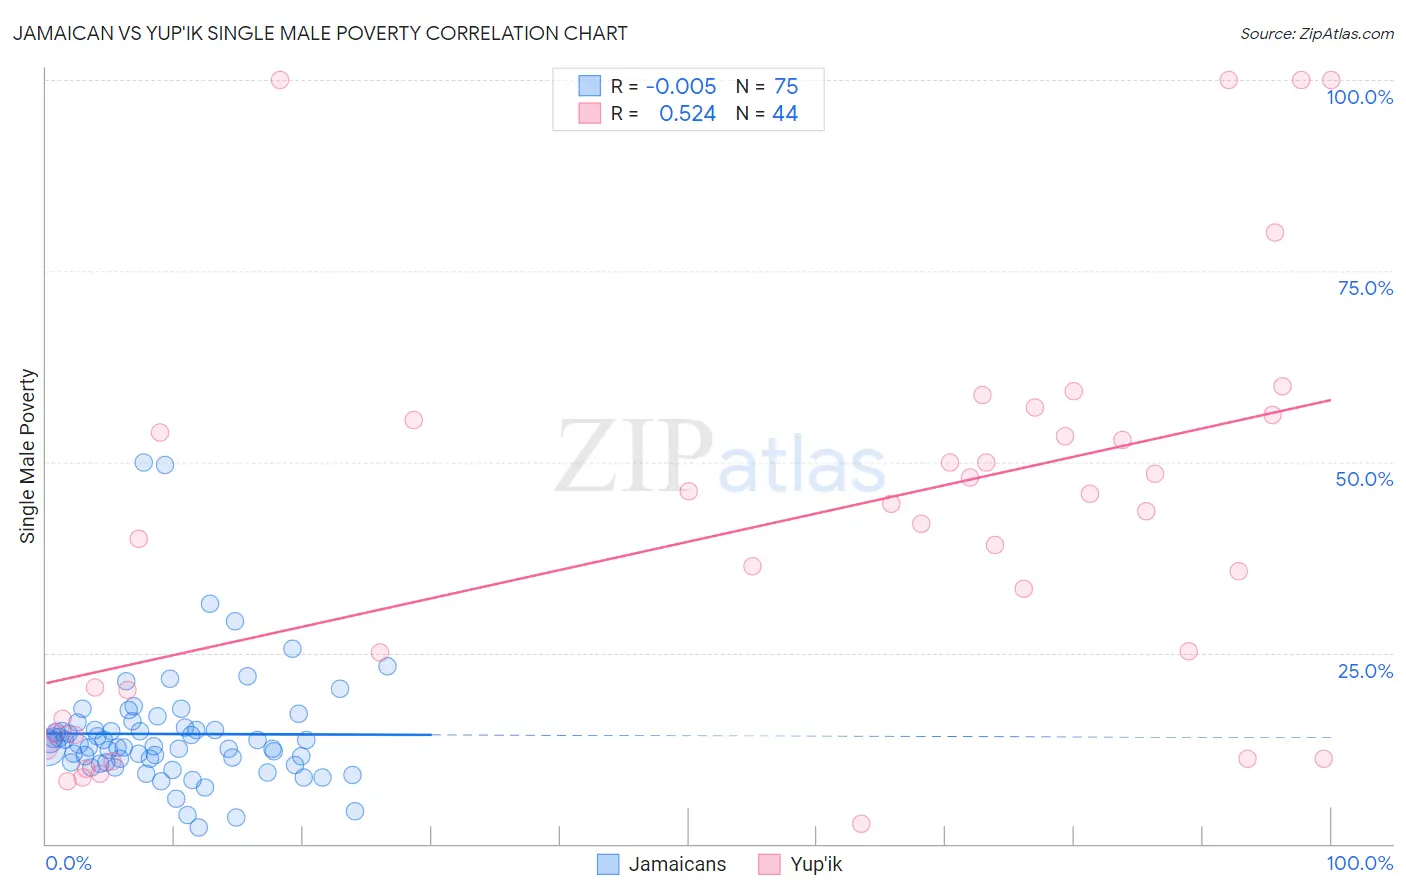
Jamaican vs Yup'ik Single Male Poverty Correlation Chart
The statistical analysis conducted on geographies consisting of 330,158,708 people shows no correlation between the proportion of Jamaicans and poverty level among single males in the United States with a correlation coefficient (R) of -0.005 and weighted average of 13.2%. Similarly, the statistical analysis conducted on geographies consisting of 38,853,365 people shows a substantial positive correlation between the proportion of Yup'ik and poverty level among single males in the United States with a correlation coefficient (R) of 0.524 and weighted average of 31.6%, a difference of 139.3%.
Single Male Poverty Correlation Summary
| Measurement | Jamaican | Yup'ik |
| Minimum | 2.1% | 2.6% |
| Maximum | 50.0% | 100.0% |
| Range | 47.9% | 97.4% |
| Mean | 14.4% | 41.1% |
| Median | 12.7% | 42.7% |
| Interquartile 25% (IQ1) | 10.6% | 15.4% |
| Interquartile 75% (IQ3) | 15.2% | 54.7% |
| Interquartile Range (IQR) | 4.5% | 39.3% |
| Standard Deviation (Sample) | 7.8% | 26.6% |
| Standard Deviation (Population) | 7.8% | 26.3% |
Similar Demographics by Single Male Poverty
Demographics Similar to Jamaicans by Single Male Poverty
In terms of single male poverty, the demographic groups most similar to Jamaicans are Haitian (13.2%, a difference of 0.13%), Immigrants from Denmark (13.2%, a difference of 0.16%), Lebanese (13.2%, a difference of 0.21%), Somali (13.2%, a difference of 0.22%), and Immigrants from the Azores (13.2%, a difference of 0.25%).
| Demographics | Rating | Rank | Single Male Poverty |
| Immigrants | Burma/Myanmar | 12.6 /100 | #219 | Poor 13.1% |
| Central Americans | 10.9 /100 | #220 | Poor 13.2% |
| New Zealanders | 10.7 /100 | #221 | Poor 13.2% |
| Immigrants | Western Europe | 10.0 /100 | #222 | Poor 13.2% |
| Immigrants | Azores | 9.3 /100 | #223 | Tragic 13.2% |
| Somalis | 9.1 /100 | #224 | Tragic 13.2% |
| Immigrants | Denmark | 8.7 /100 | #225 | Tragic 13.2% |
| Jamaicans | 7.7 /100 | #226 | Tragic 13.2% |
| Haitians | 7.0 /100 | #227 | Tragic 13.2% |
| Lebanese | 6.6 /100 | #228 | Tragic 13.2% |
| Europeans | 6.2 /100 | #229 | Tragic 13.3% |
| Ghanaians | 6.1 /100 | #230 | Tragic 13.3% |
| Slavs | 5.3 /100 | #231 | Tragic 13.3% |
| Immigrants | Caribbean | 5.0 /100 | #232 | Tragic 13.3% |
| British | 4.0 /100 | #233 | Tragic 13.3% |
Demographics Similar to Yup'ik by Single Male Poverty
In terms of single male poverty, the demographic groups most similar to Yup'ik are Hopi (27.5%, a difference of 15.0%), Navajo (25.3%, a difference of 24.8%), Lumbee (25.2%, a difference of 25.7%), Puerto Rican (25.1%, a difference of 26.1%), and Houma (23.5%, a difference of 34.9%).
| Demographics | Rating | Rank | Single Male Poverty |
| Inupiat | 0.0 /100 | #333 | Tragic 20.0% |
| Pima | 0.0 /100 | #334 | Tragic 20.2% |
| Yuman | 0.0 /100 | #335 | Tragic 21.3% |
| Tohono O'odham | 0.0 /100 | #336 | Tragic 21.6% |
| Apache | 0.0 /100 | #337 | Tragic 21.6% |
| Pueblo | 0.0 /100 | #338 | Tragic 21.6% |
| Arapaho | 0.0 /100 | #339 | Tragic 21.9% |
| Sioux | 0.0 /100 | #340 | Tragic 22.2% |
| Crow | 0.0 /100 | #341 | Tragic 23.3% |
| Houma | 0.0 /100 | #342 | Tragic 23.5% |
| Puerto Ricans | 0.0 /100 | #343 | Tragic 25.1% |
| Lumbee | 0.0 /100 | #344 | Tragic 25.2% |
| Navajo | 0.0 /100 | #345 | Tragic 25.3% |
| Hopi | 0.0 /100 | #346 | Tragic 27.5% |
| Yup'ik | 0.0 /100 | #347 | Tragic 31.6% |