Immigrants from Somalia vs Yup'ik Single Male Poverty
COMPARE
Immigrants from Somalia
Yup'ik
Single Male Poverty
Single Male Poverty Comparison
Immigrants from Somalia
Yup'ik
13.6%
SINGLE MALE POVERTY
1.0/ 100
METRIC RATING
250th/ 347
METRIC RANK
31.6%
SINGLE MALE POVERTY
0.0/ 100
METRIC RATING
347th/ 347
METRIC RANK
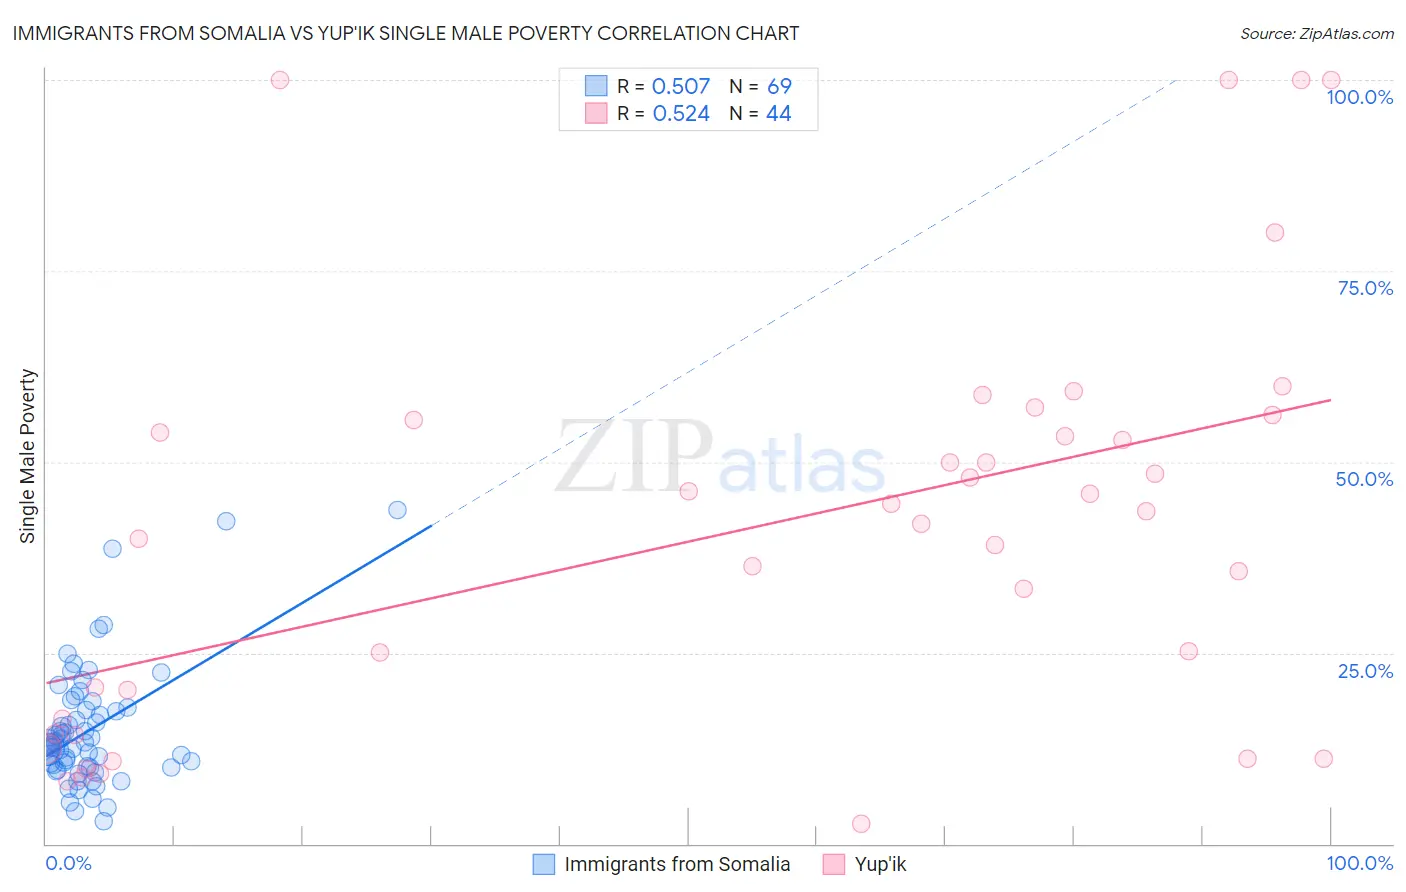
Immigrants from Somalia vs Yup'ik Single Male Poverty Correlation Chart
The statistical analysis conducted on geographies consisting of 88,720,469 people shows a substantial positive correlation between the proportion of Immigrants from Somalia and poverty level among single males in the United States with a correlation coefficient (R) of 0.507 and weighted average of 13.6%. Similarly, the statistical analysis conducted on geographies consisting of 38,853,365 people shows a substantial positive correlation between the proportion of Yup'ik and poverty level among single males in the United States with a correlation coefficient (R) of 0.524 and weighted average of 31.6%, a difference of 133.0%.
Single Male Poverty Correlation Summary
| Measurement | Immigrants from Somalia | Yup'ik |
| Minimum | 3.0% | 2.6% |
| Maximum | 43.7% | 100.0% |
| Range | 40.7% | 97.4% |
| Mean | 14.9% | 41.1% |
| Median | 13.1% | 42.7% |
| Interquartile 25% (IQ1) | 10.0% | 15.4% |
| Interquartile 75% (IQ3) | 17.7% | 54.7% |
| Interquartile Range (IQR) | 7.6% | 39.3% |
| Standard Deviation (Sample) | 7.9% | 26.6% |
| Standard Deviation (Population) | 7.9% | 26.3% |
Similar Demographics by Single Male Poverty
Demographics Similar to Immigrants from Somalia by Single Male Poverty
In terms of single male poverty, the demographic groups most similar to Immigrants from Somalia are Spanish (13.6%, a difference of 0.020%), Immigrants from Zaire (13.6%, a difference of 0.11%), Finnish (13.6%, a difference of 0.15%), Czech (13.5%, a difference of 0.26%), and Belgian (13.5%, a difference of 0.29%).
| Demographics | Rating | Rank | Single Male Poverty |
| Barbadians | 2.1 /100 | #243 | Tragic 13.4% |
| Immigrants | Senegal | 1.7 /100 | #244 | Tragic 13.5% |
| Immigrants | Latin America | 1.3 /100 | #245 | Tragic 13.5% |
| Immigrants | Micronesia | 1.2 /100 | #246 | Tragic 13.5% |
| Belgians | 1.2 /100 | #247 | Tragic 13.5% |
| Czechs | 1.2 /100 | #248 | Tragic 13.5% |
| Spanish | 1.0 /100 | #249 | Tragic 13.6% |
| Immigrants | Somalia | 1.0 /100 | #250 | Tragic 13.6% |
| Immigrants | Zaire | 0.9 /100 | #251 | Tragic 13.6% |
| Finns | 0.9 /100 | #252 | Tragic 13.6% |
| German Russians | 0.8 /100 | #253 | Tragic 13.6% |
| Sub-Saharan Africans | 0.5 /100 | #254 | Tragic 13.7% |
| Spaniards | 0.4 /100 | #255 | Tragic 13.7% |
| Immigrants | Belize | 0.4 /100 | #256 | Tragic 13.7% |
| Immigrants | Central America | 0.3 /100 | #257 | Tragic 13.8% |
Demographics Similar to Yup'ik by Single Male Poverty
In terms of single male poverty, the demographic groups most similar to Yup'ik are Hopi (27.5%, a difference of 15.0%), Navajo (25.3%, a difference of 24.8%), Lumbee (25.2%, a difference of 25.7%), Puerto Rican (25.1%, a difference of 26.1%), and Houma (23.5%, a difference of 34.9%).
| Demographics | Rating | Rank | Single Male Poverty |
| Inupiat | 0.0 /100 | #333 | Tragic 20.0% |
| Pima | 0.0 /100 | #334 | Tragic 20.2% |
| Yuman | 0.0 /100 | #335 | Tragic 21.3% |
| Tohono O'odham | 0.0 /100 | #336 | Tragic 21.6% |
| Apache | 0.0 /100 | #337 | Tragic 21.6% |
| Pueblo | 0.0 /100 | #338 | Tragic 21.6% |
| Arapaho | 0.0 /100 | #339 | Tragic 21.9% |
| Sioux | 0.0 /100 | #340 | Tragic 22.2% |
| Crow | 0.0 /100 | #341 | Tragic 23.3% |
| Houma | 0.0 /100 | #342 | Tragic 23.5% |
| Puerto Ricans | 0.0 /100 | #343 | Tragic 25.1% |
| Lumbee | 0.0 /100 | #344 | Tragic 25.2% |
| Navajo | 0.0 /100 | #345 | Tragic 25.3% |
| Hopi | 0.0 /100 | #346 | Tragic 27.5% |
| Yup'ik | 0.0 /100 | #347 | Tragic 31.6% |