Macedonian vs Immigrants from Fiji Female Poverty
COMPARE
Macedonian
Immigrants from Fiji
Female Poverty
Female Poverty Comparison
Macedonians
Immigrants from Fiji
11.8%
FEMALE POVERTY
99.3/ 100
METRIC RATING
40th/ 347
METRIC RANK
13.2%
FEMALE POVERTY
71.0/ 100
METRIC RATING
153rd/ 347
METRIC RANK
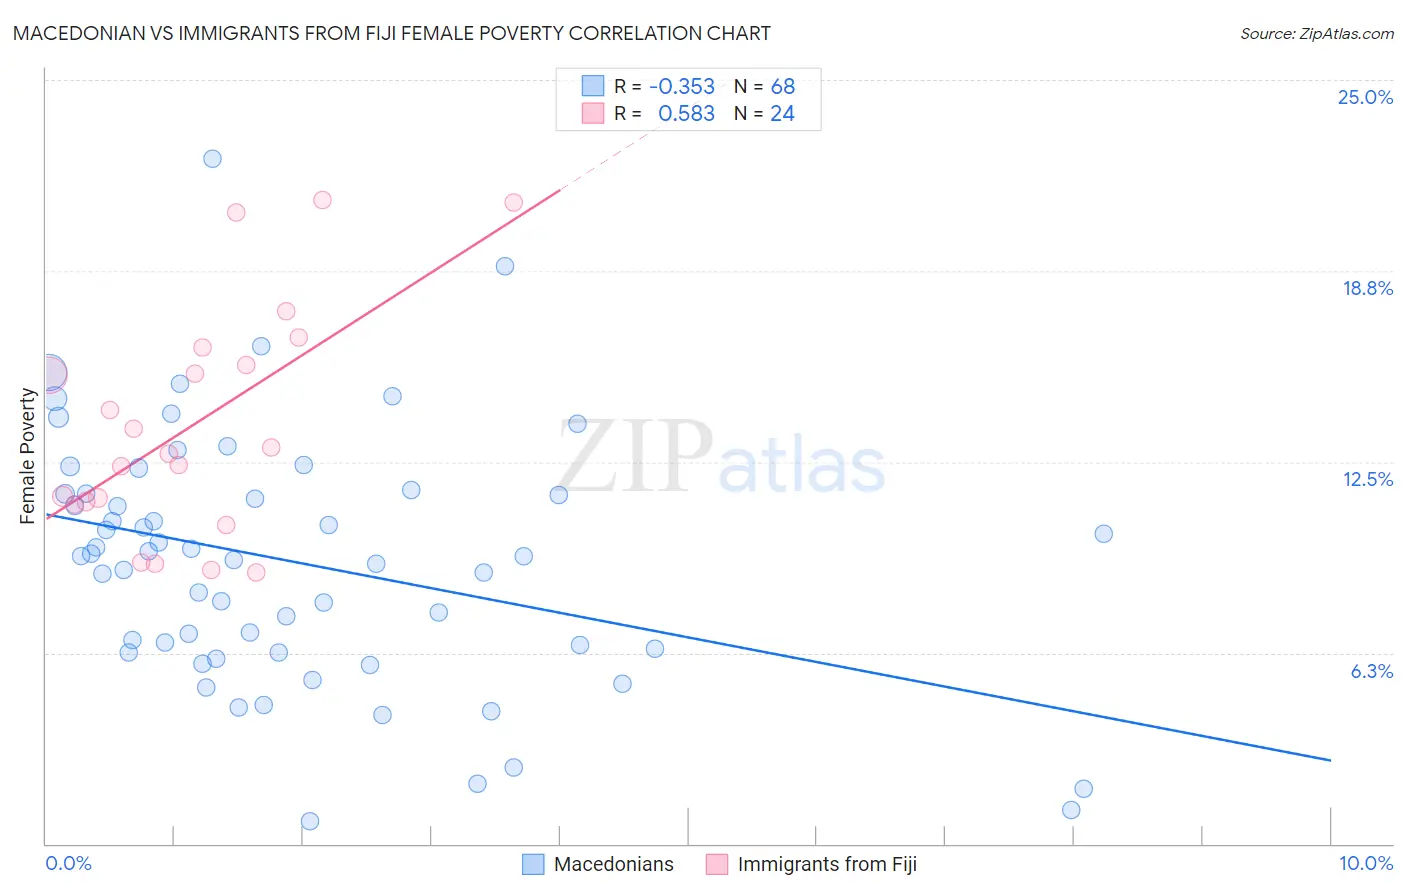
Macedonian vs Immigrants from Fiji Female Poverty Correlation Chart
The statistical analysis conducted on geographies consisting of 132,594,768 people shows a mild negative correlation between the proportion of Macedonians and poverty level among females in the United States with a correlation coefficient (R) of -0.353 and weighted average of 11.8%. Similarly, the statistical analysis conducted on geographies consisting of 93,754,712 people shows a substantial positive correlation between the proportion of Immigrants from Fiji and poverty level among females in the United States with a correlation coefficient (R) of 0.583 and weighted average of 13.2%, a difference of 11.0%.
Female Poverty Correlation Summary
| Measurement | Macedonian | Immigrants from Fiji |
| Minimum | 0.74% | 8.9% |
| Maximum | 22.4% | 21.1% |
| Range | 21.7% | 12.2% |
| Mean | 9.2% | 13.7% |
| Median | 9.4% | 12.9% |
| Interquartile 25% (IQ1) | 6.3% | 11.2% |
| Interquartile 75% (IQ3) | 11.5% | 16.0% |
| Interquartile Range (IQR) | 5.1% | 4.8% |
| Standard Deviation (Sample) | 4.1% | 3.7% |
| Standard Deviation (Population) | 4.1% | 3.7% |
Similar Demographics by Female Poverty
Demographics Similar to Macedonians by Female Poverty
In terms of female poverty, the demographic groups most similar to Macedonians are Immigrants from Poland (11.8%, a difference of 0.050%), Czech (11.9%, a difference of 0.18%), Immigrants from Moldova (11.9%, a difference of 0.18%), Korean (11.9%, a difference of 0.22%), and Russian (11.8%, a difference of 0.26%).
| Demographics | Rating | Rank | Female Poverty |
| Cypriots | 99.5 /100 | #33 | Exceptional 11.8% |
| Immigrants | Singapore | 99.4 /100 | #34 | Exceptional 11.8% |
| Immigrants | Iran | 99.4 /100 | #35 | Exceptional 11.8% |
| Immigrants | Pakistan | 99.4 /100 | #36 | Exceptional 11.8% |
| Immigrants | Greece | 99.3 /100 | #37 | Exceptional 11.8% |
| Russians | 99.3 /100 | #38 | Exceptional 11.8% |
| Immigrants | Poland | 99.3 /100 | #39 | Exceptional 11.8% |
| Macedonians | 99.3 /100 | #40 | Exceptional 11.8% |
| Czechs | 99.2 /100 | #41 | Exceptional 11.9% |
| Immigrants | Moldova | 99.2 /100 | #42 | Exceptional 11.9% |
| Koreans | 99.2 /100 | #43 | Exceptional 11.9% |
| Tongans | 99.2 /100 | #44 | Exceptional 11.9% |
| Immigrants | Czechoslovakia | 99.2 /100 | #45 | Exceptional 11.9% |
| Turks | 99.2 /100 | #46 | Exceptional 11.9% |
| Asians | 99.1 /100 | #47 | Exceptional 11.9% |
Demographics Similar to Immigrants from Fiji by Female Poverty
In terms of female poverty, the demographic groups most similar to Immigrants from Fiji are Armenian (13.2%, a difference of 0.070%), Hungarian (13.2%, a difference of 0.10%), Immigrants from Bosnia and Herzegovina (13.2%, a difference of 0.15%), Immigrants from Northern Africa (13.2%, a difference of 0.25%), and Samoan (13.1%, a difference of 0.32%).
| Demographics | Rating | Rank | Female Poverty |
| Immigrants | Peru | 79.1 /100 | #146 | Good 13.0% |
| Immigrants | Kazakhstan | 78.6 /100 | #147 | Good 13.0% |
| Yugoslavians | 76.9 /100 | #148 | Good 13.1% |
| Taiwanese | 75.7 /100 | #149 | Good 13.1% |
| Tsimshian | 75.5 /100 | #150 | Good 13.1% |
| Immigrants | Germany | 74.9 /100 | #151 | Good 13.1% |
| Samoans | 73.6 /100 | #152 | Good 13.1% |
| Immigrants | Fiji | 71.0 /100 | #153 | Good 13.2% |
| Armenians | 70.4 /100 | #154 | Good 13.2% |
| Hungarians | 70.1 /100 | #155 | Good 13.2% |
| Immigrants | Bosnia and Herzegovina | 69.7 /100 | #156 | Good 13.2% |
| Immigrants | Northern Africa | 68.8 /100 | #157 | Good 13.2% |
| Pennsylvania Germans | 67.3 /100 | #158 | Good 13.2% |
| Costa Ricans | 63.6 /100 | #159 | Good 13.3% |
| Immigrants | Nepal | 62.7 /100 | #160 | Good 13.3% |