Macedonian vs Immigrants from Fiji Male Poverty
COMPARE
Macedonian
Immigrants from Fiji
Male Poverty
Male Poverty Comparison
Macedonians
Immigrants from Fiji
9.7%
MALE POVERTY
99.5/ 100
METRIC RATING
32nd/ 347
METRIC RANK
11.2%
MALE POVERTY
46.0/ 100
METRIC RATING
176th/ 347
METRIC RANK
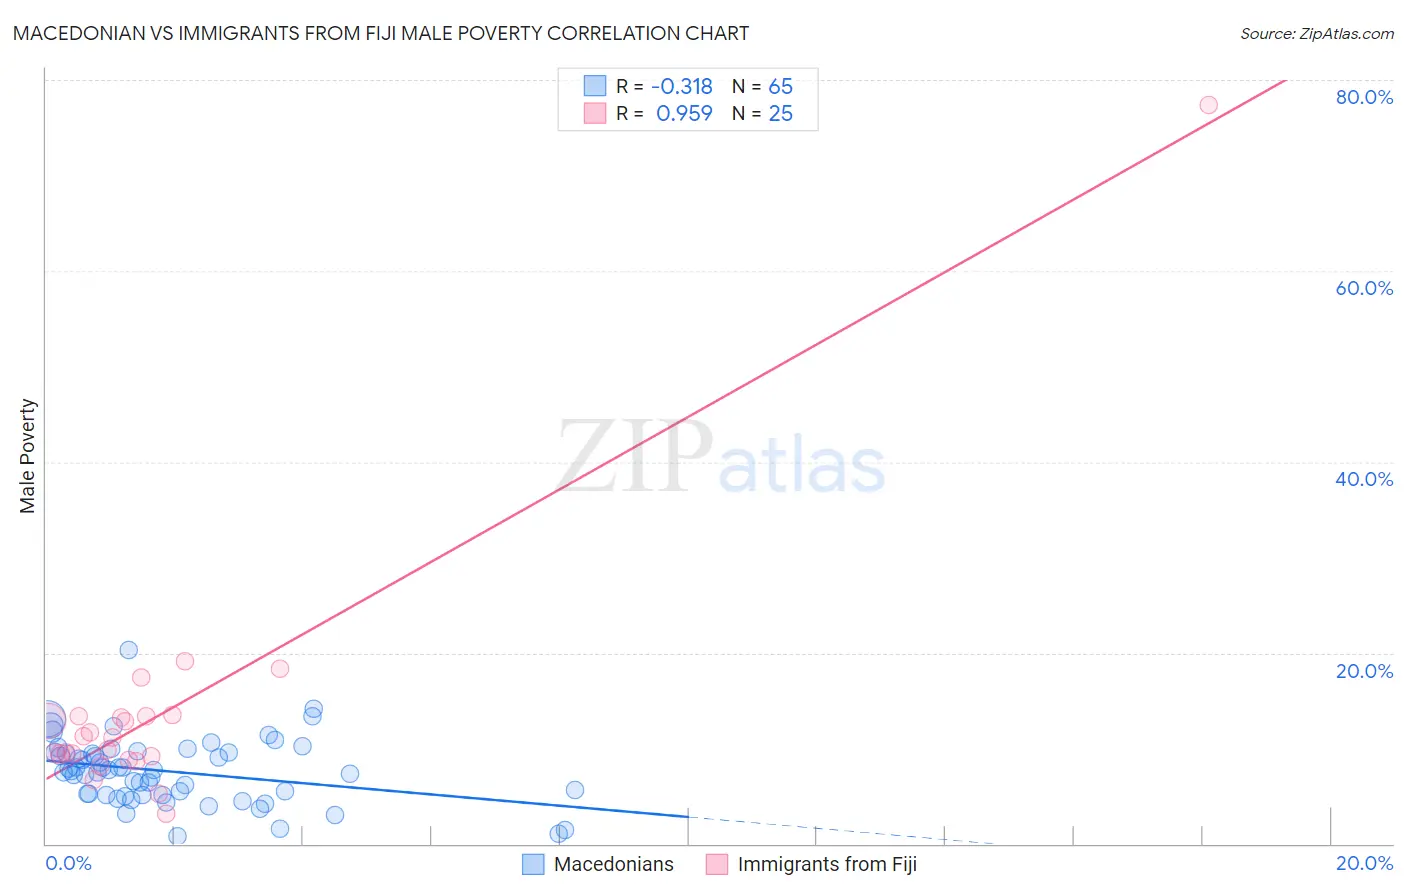
Macedonian vs Immigrants from Fiji Male Poverty Correlation Chart
The statistical analysis conducted on geographies consisting of 132,583,851 people shows a mild negative correlation between the proportion of Macedonians and poverty level among males in the United States with a correlation coefficient (R) of -0.318 and weighted average of 9.7%. Similarly, the statistical analysis conducted on geographies consisting of 93,752,822 people shows a perfect positive correlation between the proportion of Immigrants from Fiji and poverty level among males in the United States with a correlation coefficient (R) of 0.959 and weighted average of 11.2%, a difference of 15.3%.
Male Poverty Correlation Summary
| Measurement | Macedonian | Immigrants from Fiji |
| Minimum | 0.75% | 3.1% |
| Maximum | 20.3% | 77.3% |
| Range | 19.6% | 74.2% |
| Mean | 7.6% | 13.7% |
| Median | 7.6% | 11.1% |
| Interquartile 25% (IQ1) | 5.1% | 9.0% |
| Interquartile 75% (IQ3) | 9.5% | 13.4% |
| Interquartile Range (IQR) | 4.4% | 4.4% |
| Standard Deviation (Sample) | 3.4% | 13.8% |
| Standard Deviation (Population) | 3.4% | 13.5% |
Similar Demographics by Male Poverty
Demographics Similar to Macedonians by Male Poverty
In terms of male poverty, the demographic groups most similar to Macedonians are Immigrants from Northern Europe (9.7%, a difference of 0.090%), Tongan (9.7%, a difference of 0.21%), Polish (9.7%, a difference of 0.23%), Immigrants from Poland (9.8%, a difference of 0.23%), and Greek (9.7%, a difference of 0.30%).
| Demographics | Rating | Rank | Male Poverty |
| Eastern Europeans | 99.6 /100 | #25 | Exceptional 9.6% |
| Burmese | 99.6 /100 | #26 | Exceptional 9.7% |
| Danes | 99.6 /100 | #27 | Exceptional 9.7% |
| Immigrants | Korea | 99.6 /100 | #28 | Exceptional 9.7% |
| Greeks | 99.6 /100 | #29 | Exceptional 9.7% |
| Poles | 99.5 /100 | #30 | Exceptional 9.7% |
| Tongans | 99.5 /100 | #31 | Exceptional 9.7% |
| Macedonians | 99.5 /100 | #32 | Exceptional 9.7% |
| Immigrants | Northern Europe | 99.5 /100 | #33 | Exceptional 9.7% |
| Immigrants | Poland | 99.5 /100 | #34 | Exceptional 9.8% |
| Iranians | 99.4 /100 | #35 | Exceptional 9.8% |
| Czechs | 99.4 /100 | #36 | Exceptional 9.8% |
| Immigrants | Greece | 99.3 /100 | #37 | Exceptional 9.8% |
| Immigrants | Pakistan | 99.2 /100 | #38 | Exceptional 9.9% |
| Russians | 99.2 /100 | #39 | Exceptional 9.9% |
Demographics Similar to Immigrants from Fiji by Male Poverty
In terms of male poverty, the demographic groups most similar to Immigrants from Fiji are Lebanese (11.2%, a difference of 0.040%), Celtic (11.2%, a difference of 0.14%), Immigrants from Cameroon (11.2%, a difference of 0.15%), Immigrants from Oceania (11.2%, a difference of 0.39%), and Pennsylvania German (11.2%, a difference of 0.44%).
| Demographics | Rating | Rank | Male Poverty |
| Immigrants | Colombia | 54.2 /100 | #169 | Average 11.1% |
| South Americans | 53.8 /100 | #170 | Average 11.1% |
| Uruguayans | 51.0 /100 | #171 | Average 11.2% |
| Immigrants | Ethiopia | 50.7 /100 | #172 | Average 11.2% |
| Pennsylvania Germans | 50.5 /100 | #173 | Average 11.2% |
| Immigrants | Oceania | 50.0 /100 | #174 | Average 11.2% |
| Celtics | 47.5 /100 | #175 | Average 11.2% |
| Immigrants | Fiji | 46.0 /100 | #176 | Average 11.2% |
| Lebanese | 45.6 /100 | #177 | Average 11.2% |
| Immigrants | Cameroon | 44.5 /100 | #178 | Average 11.2% |
| Immigrants | Syria | 40.3 /100 | #179 | Average 11.3% |
| Immigrants | Morocco | 40.1 /100 | #180 | Average 11.3% |
| Immigrants | Costa Rica | 39.5 /100 | #181 | Fair 11.3% |
| Mongolians | 39.0 /100 | #182 | Fair 11.3% |
| Kenyans | 38.4 /100 | #183 | Fair 11.3% |