Macedonian vs Immigrants from Southern Europe Female Poverty
COMPARE
Macedonian
Immigrants from Southern Europe
Female Poverty
Female Poverty Comparison
Macedonians
Immigrants from Southern Europe
11.8%
FEMALE POVERTY
99.3/ 100
METRIC RATING
40th/ 347
METRIC RANK
12.7%
FEMALE POVERTY
90.9/ 100
METRIC RATING
117th/ 347
METRIC RANK
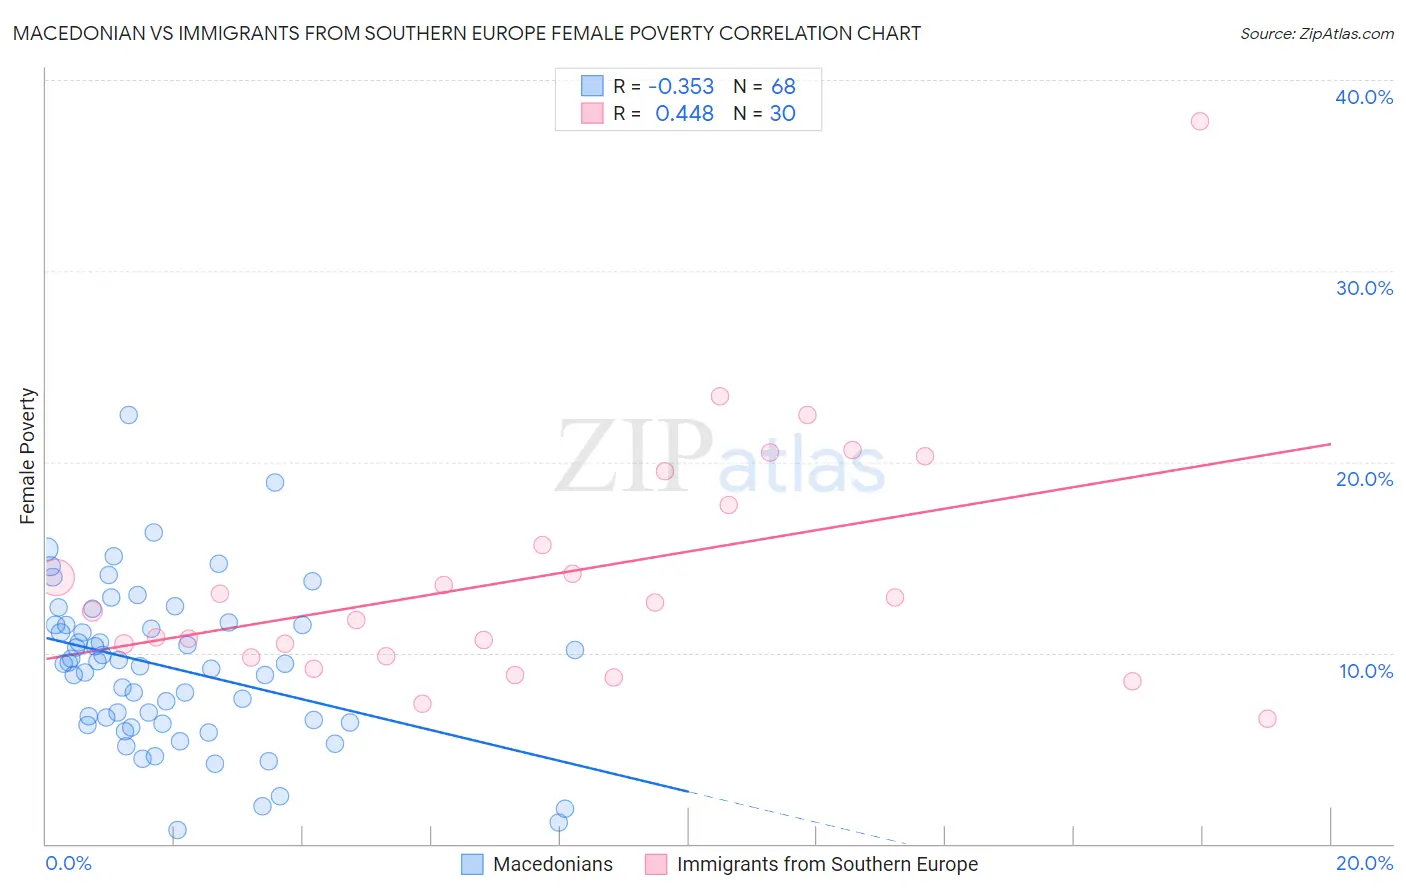
Macedonian vs Immigrants from Southern Europe Female Poverty Correlation Chart
The statistical analysis conducted on geographies consisting of 132,594,768 people shows a mild negative correlation between the proportion of Macedonians and poverty level among females in the United States with a correlation coefficient (R) of -0.353 and weighted average of 11.8%. Similarly, the statistical analysis conducted on geographies consisting of 402,507,069 people shows a moderate positive correlation between the proportion of Immigrants from Southern Europe and poverty level among females in the United States with a correlation coefficient (R) of 0.448 and weighted average of 12.7%, a difference of 7.1%.
Female Poverty Correlation Summary
| Measurement | Macedonian | Immigrants from Southern Europe |
| Minimum | 0.74% | 6.6% |
| Maximum | 22.4% | 37.8% |
| Range | 21.7% | 31.3% |
| Mean | 9.2% | 14.1% |
| Median | 9.4% | 12.4% |
| Interquartile 25% (IQ1) | 6.3% | 9.8% |
| Interquartile 75% (IQ3) | 11.5% | 17.8% |
| Interquartile Range (IQR) | 5.1% | 8.0% |
| Standard Deviation (Sample) | 4.1% | 6.5% |
| Standard Deviation (Population) | 4.1% | 6.4% |
Similar Demographics by Female Poverty
Demographics Similar to Macedonians by Female Poverty
In terms of female poverty, the demographic groups most similar to Macedonians are Immigrants from Poland (11.8%, a difference of 0.050%), Czech (11.9%, a difference of 0.18%), Immigrants from Moldova (11.9%, a difference of 0.18%), Korean (11.9%, a difference of 0.22%), and Russian (11.8%, a difference of 0.26%).
| Demographics | Rating | Rank | Female Poverty |
| Cypriots | 99.5 /100 | #33 | Exceptional 11.8% |
| Immigrants | Singapore | 99.4 /100 | #34 | Exceptional 11.8% |
| Immigrants | Iran | 99.4 /100 | #35 | Exceptional 11.8% |
| Immigrants | Pakistan | 99.4 /100 | #36 | Exceptional 11.8% |
| Immigrants | Greece | 99.3 /100 | #37 | Exceptional 11.8% |
| Russians | 99.3 /100 | #38 | Exceptional 11.8% |
| Immigrants | Poland | 99.3 /100 | #39 | Exceptional 11.8% |
| Macedonians | 99.3 /100 | #40 | Exceptional 11.8% |
| Czechs | 99.2 /100 | #41 | Exceptional 11.9% |
| Immigrants | Moldova | 99.2 /100 | #42 | Exceptional 11.9% |
| Koreans | 99.2 /100 | #43 | Exceptional 11.9% |
| Tongans | 99.2 /100 | #44 | Exceptional 11.9% |
| Immigrants | Czechoslovakia | 99.2 /100 | #45 | Exceptional 11.9% |
| Turks | 99.2 /100 | #46 | Exceptional 11.9% |
| Asians | 99.1 /100 | #47 | Exceptional 11.9% |
Demographics Similar to Immigrants from Southern Europe by Female Poverty
In terms of female poverty, the demographic groups most similar to Immigrants from Southern Europe are Sri Lankan (12.7%, a difference of 0.020%), Albanian (12.7%, a difference of 0.030%), Immigrants from Russia (12.7%, a difference of 0.070%), New Zealander (12.7%, a difference of 0.090%), and Immigrants from Hungary (12.7%, a difference of 0.19%).
| Demographics | Rating | Rank | Female Poverty |
| Paraguayans | 93.0 /100 | #110 | Exceptional 12.6% |
| Soviet Union | 92.4 /100 | #111 | Exceptional 12.6% |
| Immigrants | Israel | 92.0 /100 | #112 | Exceptional 12.6% |
| Canadians | 92.0 /100 | #113 | Exceptional 12.7% |
| Welsh | 91.6 /100 | #114 | Exceptional 12.7% |
| Puget Sound Salish | 91.5 /100 | #115 | Exceptional 12.7% |
| Immigrants | Russia | 91.2 /100 | #116 | Exceptional 12.7% |
| Immigrants | Southern Europe | 90.9 /100 | #117 | Exceptional 12.7% |
| Sri Lankans | 90.9 /100 | #118 | Exceptional 12.7% |
| Albanians | 90.8 /100 | #119 | Exceptional 12.7% |
| New Zealanders | 90.6 /100 | #120 | Exceptional 12.7% |
| Immigrants | Hungary | 90.3 /100 | #121 | Exceptional 12.7% |
| French Canadians | 90.2 /100 | #122 | Exceptional 12.7% |
| Immigrants | South Eastern Asia | 89.9 /100 | #123 | Excellent 12.7% |
| Immigrants | Norway | 89.3 /100 | #124 | Excellent 12.8% |