Macedonian vs Immigrants from Fiji Per Capita Income
COMPARE
Macedonian
Immigrants from Fiji
Per Capita Income
Per Capita Income Comparison
Macedonians
Immigrants from Fiji
$47,573
PER CAPITA INCOME
98.8/ 100
METRIC RATING
91st/ 347
METRIC RANK
$42,694
PER CAPITA INCOME
25.2/ 100
METRIC RATING
194th/ 347
METRIC RANK
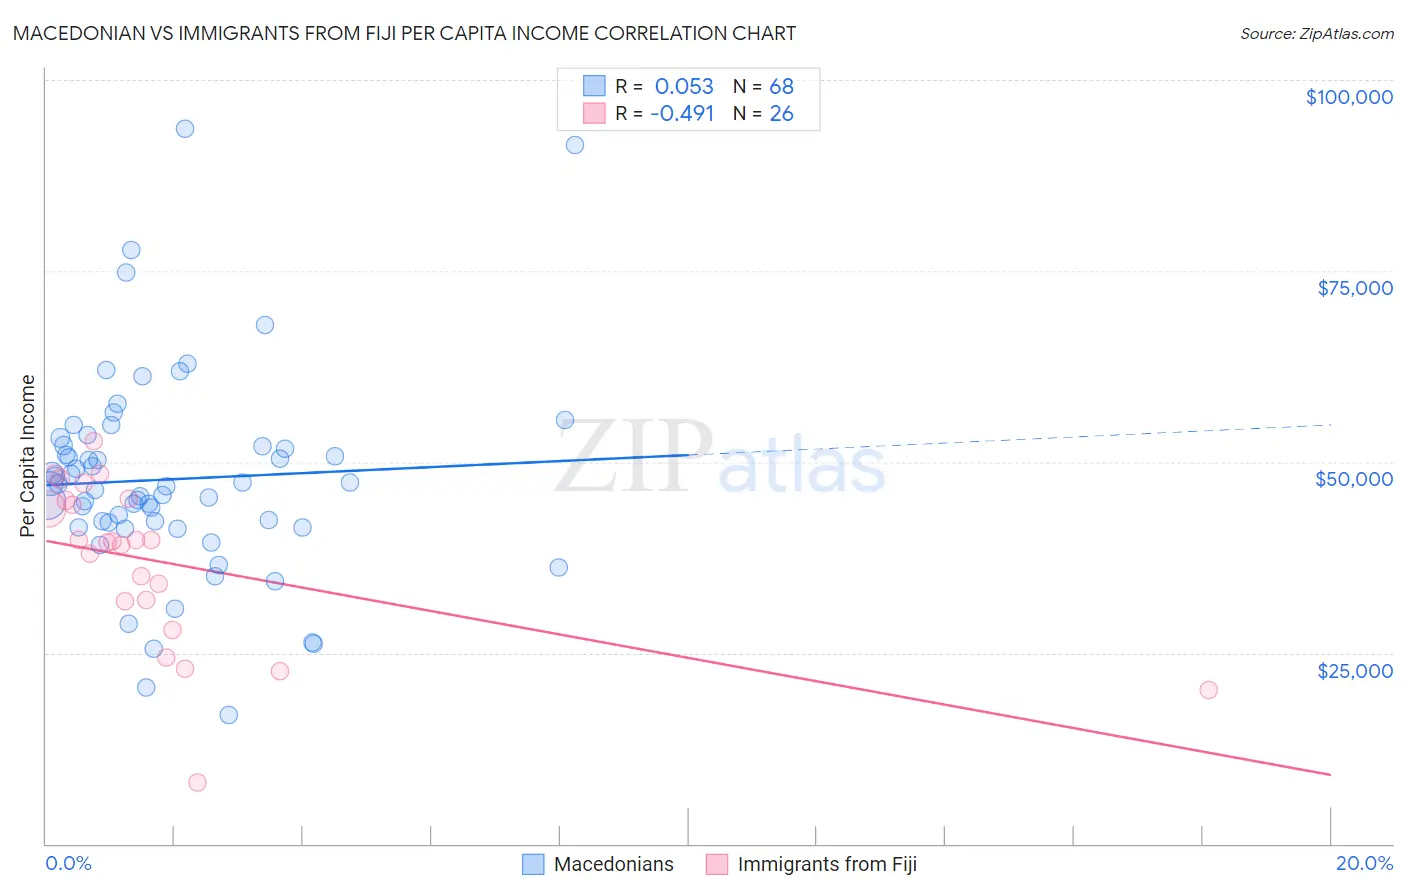
Macedonian vs Immigrants from Fiji Per Capita Income Correlation Chart
The statistical analysis conducted on geographies consisting of 132,587,632 people shows a slight positive correlation between the proportion of Macedonians and per capita income in the United States with a correlation coefficient (R) of 0.053 and weighted average of $47,573. Similarly, the statistical analysis conducted on geographies consisting of 93,756,204 people shows a moderate negative correlation between the proportion of Immigrants from Fiji and per capita income in the United States with a correlation coefficient (R) of -0.491 and weighted average of $42,694, a difference of 11.4%.
Per Capita Income Correlation Summary
| Measurement | Macedonian | Immigrants from Fiji |
| Minimum | $16,916 | $8,026 |
| Maximum | $93,662 | $52,700 |
| Range | $76,746 | $44,674 |
| Mean | $47,728 | $36,824 |
| Median | $46,977 | $39,532 |
| Interquartile 25% (IQ1) | $41,808 | $31,785 |
| Interquartile 75% (IQ3) | $52,108 | $44,942 |
| Interquartile Range (IQR) | $10,300 | $13,157 |
| Standard Deviation (Sample) | $13,530 | $10,646 |
| Standard Deviation (Population) | $13,431 | $10,440 |
Similar Demographics by Per Capita Income
Demographics Similar to Macedonians by Per Capita Income
In terms of per capita income, the demographic groups most similar to Macedonians are Italian ($47,574, a difference of 0.0%), Immigrants from Moldova ($47,489, a difference of 0.18%), Northern European ($47,698, a difference of 0.26%), Croatian ($47,742, a difference of 0.36%), and Immigrants from Zimbabwe ($47,394, a difference of 0.38%).
| Demographics | Rating | Rank | Per Capita Income |
| Immigrants | Ukraine | 99.3 /100 | #84 | Exceptional $48,134 |
| Austrians | 99.3 /100 | #85 | Exceptional $48,116 |
| Immigrants | Southern Europe | 99.3 /100 | #86 | Exceptional $48,027 |
| Ukrainians | 99.3 /100 | #87 | Exceptional $48,014 |
| Croatians | 99.0 /100 | #88 | Exceptional $47,742 |
| Northern Europeans | 98.9 /100 | #89 | Exceptional $47,698 |
| Italians | 98.8 /100 | #90 | Exceptional $47,574 |
| Macedonians | 98.8 /100 | #91 | Exceptional $47,573 |
| Immigrants | Moldova | 98.7 /100 | #92 | Exceptional $47,489 |
| Immigrants | Zimbabwe | 98.5 /100 | #93 | Exceptional $47,394 |
| Albanians | 98.5 /100 | #94 | Exceptional $47,379 |
| Immigrants | Egypt | 98.5 /100 | #95 | Exceptional $47,361 |
| Alsatians | 98.3 /100 | #96 | Exceptional $47,284 |
| Carpatho Rusyns | 98.2 /100 | #97 | Exceptional $47,248 |
| Immigrants | Pakistan | 97.9 /100 | #98 | Exceptional $47,084 |
Demographics Similar to Immigrants from Fiji by Per Capita Income
In terms of per capita income, the demographic groups most similar to Immigrants from Fiji are Immigrants from Kenya ($42,661, a difference of 0.080%), Immigrants from Sierra Leone ($42,752, a difference of 0.13%), Iraqi ($42,760, a difference of 0.16%), Dutch ($42,605, a difference of 0.21%), and Yugoslavian ($42,792, a difference of 0.23%).
| Demographics | Rating | Rank | Per Capita Income |
| Immigrants | Colombia | 31.5 /100 | #187 | Fair $42,971 |
| Immigrants | Africa | 31.0 /100 | #188 | Fair $42,950 |
| Bermudans | 30.1 /100 | #189 | Fair $42,911 |
| Kenyans | 27.7 /100 | #190 | Fair $42,808 |
| Yugoslavians | 27.4 /100 | #191 | Fair $42,792 |
| Iraqis | 26.7 /100 | #192 | Fair $42,760 |
| Immigrants | Sierra Leone | 26.5 /100 | #193 | Fair $42,752 |
| Immigrants | Fiji | 25.2 /100 | #194 | Fair $42,694 |
| Immigrants | Kenya | 24.5 /100 | #195 | Fair $42,661 |
| Dutch | 23.4 /100 | #196 | Fair $42,605 |
| Scotch-Irish | 22.6 /100 | #197 | Fair $42,563 |
| Immigrants | Portugal | 19.7 /100 | #198 | Poor $42,412 |
| Barbadians | 19.6 /100 | #199 | Poor $42,406 |
| Vietnamese | 19.0 /100 | #200 | Poor $42,368 |
| Immigrants | Thailand | 17.6 /100 | #201 | Poor $42,289 |