Indonesian vs Immigrants from Fiji Female Poverty
COMPARE
Indonesian
Immigrants from Fiji
Female Poverty
Female Poverty Comparison
Indonesians
Immigrants from Fiji
16.4%
FEMALE POVERTY
0.0/ 100
METRIC RATING
288th/ 347
METRIC RANK
13.2%
FEMALE POVERTY
71.0/ 100
METRIC RATING
153rd/ 347
METRIC RANK
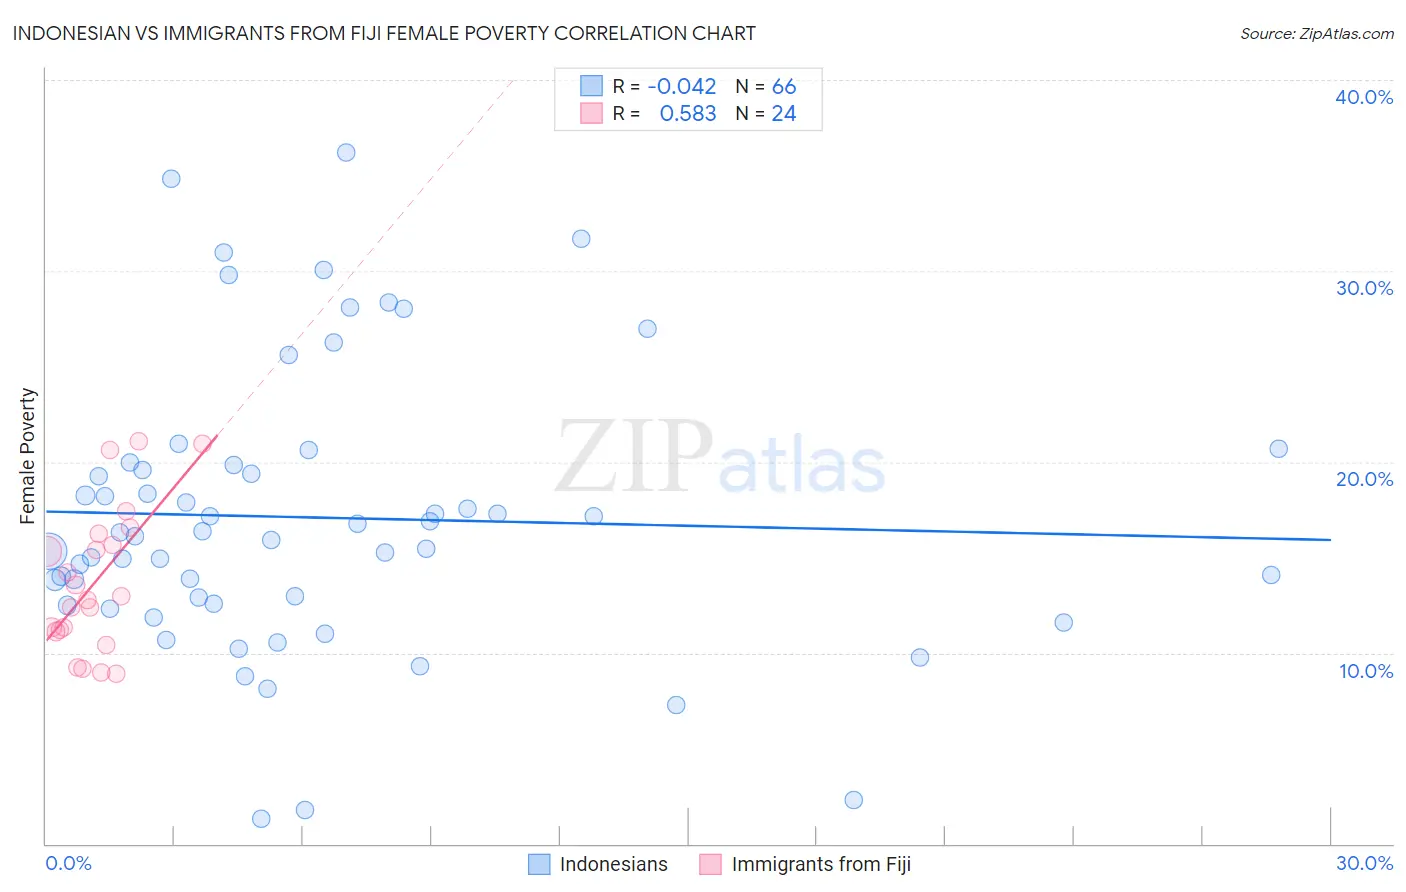
Indonesian vs Immigrants from Fiji Female Poverty Correlation Chart
The statistical analysis conducted on geographies consisting of 162,639,231 people shows no correlation between the proportion of Indonesians and poverty level among females in the United States with a correlation coefficient (R) of -0.042 and weighted average of 16.4%. Similarly, the statistical analysis conducted on geographies consisting of 93,754,712 people shows a substantial positive correlation between the proportion of Immigrants from Fiji and poverty level among females in the United States with a correlation coefficient (R) of 0.583 and weighted average of 13.2%, a difference of 24.4%.
Female Poverty Correlation Summary
| Measurement | Indonesian | Immigrants from Fiji |
| Minimum | 1.3% | 8.9% |
| Maximum | 36.2% | 21.1% |
| Range | 34.9% | 12.2% |
| Mean | 17.1% | 13.7% |
| Median | 16.2% | 12.9% |
| Interquartile 25% (IQ1) | 12.6% | 11.2% |
| Interquartile 75% (IQ3) | 19.8% | 16.0% |
| Interquartile Range (IQR) | 7.3% | 4.8% |
| Standard Deviation (Sample) | 7.4% | 3.7% |
| Standard Deviation (Population) | 7.4% | 3.7% |
Similar Demographics by Female Poverty
Demographics Similar to Indonesians by Female Poverty
In terms of female poverty, the demographic groups most similar to Indonesians are Blackfeet (16.4%, a difference of 0.010%), Immigrants from Bangladesh (16.4%, a difference of 0.20%), Yaqui (16.4%, a difference of 0.37%), Immigrants from Zaire (16.4%, a difference of 0.38%), and Immigrants from Latin America (16.4%, a difference of 0.43%).
| Demographics | Rating | Rank | Female Poverty |
| West Indians | 0.0 /100 | #281 | Tragic 16.1% |
| Immigrants | Haiti | 0.0 /100 | #282 | Tragic 16.1% |
| Immigrants | Cuba | 0.0 /100 | #283 | Tragic 16.1% |
| Spanish Americans | 0.0 /100 | #284 | Tragic 16.2% |
| Comanche | 0.0 /100 | #285 | Tragic 16.2% |
| Inupiat | 0.0 /100 | #286 | Tragic 16.2% |
| Immigrants | Belize | 0.0 /100 | #287 | Tragic 16.3% |
| Indonesians | 0.0 /100 | #288 | Tragic 16.4% |
| Blackfeet | 0.0 /100 | #289 | Tragic 16.4% |
| Immigrants | Bangladesh | 0.0 /100 | #290 | Tragic 16.4% |
| Yaqui | 0.0 /100 | #291 | Tragic 16.4% |
| Immigrants | Zaire | 0.0 /100 | #292 | Tragic 16.4% |
| Immigrants | Latin America | 0.0 /100 | #293 | Tragic 16.4% |
| Immigrants | Cabo Verde | 0.0 /100 | #294 | Tragic 16.4% |
| Senegalese | 0.0 /100 | #295 | Tragic 16.5% |
Demographics Similar to Immigrants from Fiji by Female Poverty
In terms of female poverty, the demographic groups most similar to Immigrants from Fiji are Armenian (13.2%, a difference of 0.070%), Hungarian (13.2%, a difference of 0.10%), Immigrants from Bosnia and Herzegovina (13.2%, a difference of 0.15%), Immigrants from Northern Africa (13.2%, a difference of 0.25%), and Samoan (13.1%, a difference of 0.32%).
| Demographics | Rating | Rank | Female Poverty |
| Immigrants | Peru | 79.1 /100 | #146 | Good 13.0% |
| Immigrants | Kazakhstan | 78.6 /100 | #147 | Good 13.0% |
| Yugoslavians | 76.9 /100 | #148 | Good 13.1% |
| Taiwanese | 75.7 /100 | #149 | Good 13.1% |
| Tsimshian | 75.5 /100 | #150 | Good 13.1% |
| Immigrants | Germany | 74.9 /100 | #151 | Good 13.1% |
| Samoans | 73.6 /100 | #152 | Good 13.1% |
| Immigrants | Fiji | 71.0 /100 | #153 | Good 13.2% |
| Armenians | 70.4 /100 | #154 | Good 13.2% |
| Hungarians | 70.1 /100 | #155 | Good 13.2% |
| Immigrants | Bosnia and Herzegovina | 69.7 /100 | #156 | Good 13.2% |
| Immigrants | Northern Africa | 68.8 /100 | #157 | Good 13.2% |
| Pennsylvania Germans | 67.3 /100 | #158 | Good 13.2% |
| Costa Ricans | 63.6 /100 | #159 | Good 13.3% |
| Immigrants | Nepal | 62.7 /100 | #160 | Good 13.3% |