Macedonian vs French Female Poverty
COMPARE
Macedonian
French
Female Poverty
Female Poverty Comparison
Macedonians
French
11.8%
FEMALE POVERTY
99.3/ 100
METRIC RATING
40th/ 347
METRIC RANK
12.9%
FEMALE POVERTY
85.6/ 100
METRIC RATING
135th/ 347
METRIC RANK
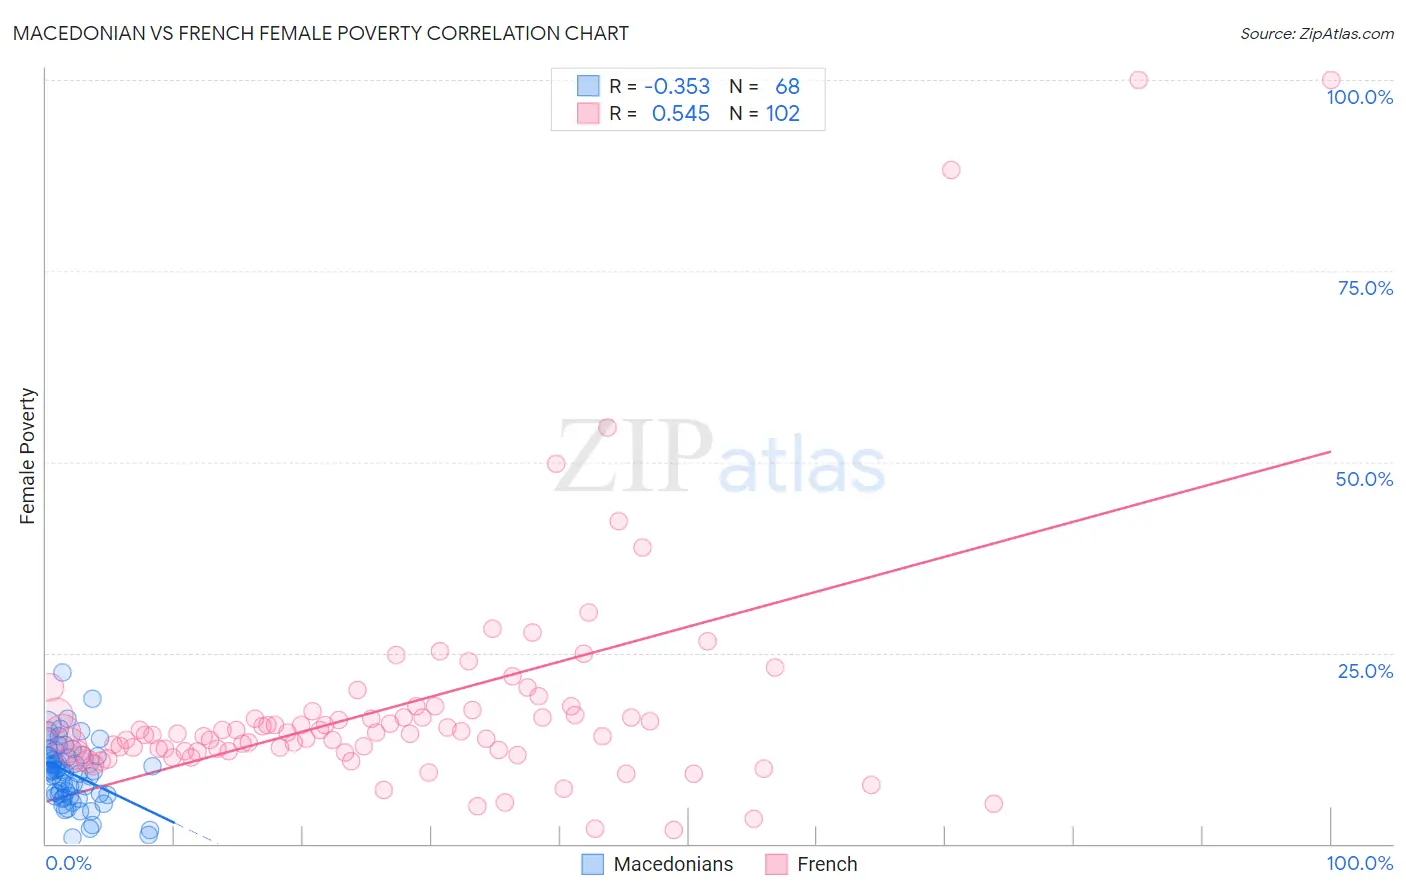
Macedonian vs French Female Poverty Correlation Chart
The statistical analysis conducted on geographies consisting of 132,594,768 people shows a mild negative correlation between the proportion of Macedonians and poverty level among females in the United States with a correlation coefficient (R) of -0.353 and weighted average of 11.8%. Similarly, the statistical analysis conducted on geographies consisting of 571,140,753 people shows a substantial positive correlation between the proportion of French and poverty level among females in the United States with a correlation coefficient (R) of 0.545 and weighted average of 12.9%, a difference of 8.6%.
Female Poverty Correlation Summary
| Measurement | Macedonian | French |
| Minimum | 0.74% | 1.8% |
| Maximum | 22.4% | 100.0% |
| Range | 21.7% | 98.2% |
| Mean | 9.2% | 18.1% |
| Median | 9.4% | 14.5% |
| Interquartile 25% (IQ1) | 6.3% | 12.1% |
| Interquartile 75% (IQ3) | 11.5% | 17.4% |
| Interquartile Range (IQR) | 5.1% | 5.3% |
| Standard Deviation (Sample) | 4.1% | 15.9% |
| Standard Deviation (Population) | 4.1% | 15.8% |
Similar Demographics by Female Poverty
Demographics Similar to Macedonians by Female Poverty
In terms of female poverty, the demographic groups most similar to Macedonians are Immigrants from Poland (11.8%, a difference of 0.050%), Czech (11.9%, a difference of 0.18%), Immigrants from Moldova (11.9%, a difference of 0.18%), Korean (11.9%, a difference of 0.22%), and Russian (11.8%, a difference of 0.26%).
| Demographics | Rating | Rank | Female Poverty |
| Cypriots | 99.5 /100 | #33 | Exceptional 11.8% |
| Immigrants | Singapore | 99.4 /100 | #34 | Exceptional 11.8% |
| Immigrants | Iran | 99.4 /100 | #35 | Exceptional 11.8% |
| Immigrants | Pakistan | 99.4 /100 | #36 | Exceptional 11.8% |
| Immigrants | Greece | 99.3 /100 | #37 | Exceptional 11.8% |
| Russians | 99.3 /100 | #38 | Exceptional 11.8% |
| Immigrants | Poland | 99.3 /100 | #39 | Exceptional 11.8% |
| Macedonians | 99.3 /100 | #40 | Exceptional 11.8% |
| Czechs | 99.2 /100 | #41 | Exceptional 11.9% |
| Immigrants | Moldova | 99.2 /100 | #42 | Exceptional 11.9% |
| Koreans | 99.2 /100 | #43 | Exceptional 11.9% |
| Tongans | 99.2 /100 | #44 | Exceptional 11.9% |
| Immigrants | Czechoslovakia | 99.2 /100 | #45 | Exceptional 11.9% |
| Turks | 99.2 /100 | #46 | Exceptional 11.9% |
| Asians | 99.1 /100 | #47 | Exceptional 11.9% |
Demographics Similar to French by Female Poverty
In terms of female poverty, the demographic groups most similar to French are Immigrants from Switzerland (12.9%, a difference of 0.050%), Peruvian (12.9%, a difference of 0.080%), Chilean (12.9%, a difference of 0.17%), Immigrants from Western Europe (12.8%, a difference of 0.22%), and Immigrants from Jordan (12.8%, a difference of 0.28%).
| Demographics | Rating | Rank | Female Poverty |
| Immigrants | Belarus | 88.2 /100 | #128 | Excellent 12.8% |
| Immigrants | Brazil | 87.9 /100 | #129 | Excellent 12.8% |
| Immigrants | Vietnam | 87.1 /100 | #130 | Excellent 12.8% |
| Immigrants | Argentina | 87.0 /100 | #131 | Excellent 12.8% |
| Immigrants | Jordan | 86.9 /100 | #132 | Excellent 12.8% |
| Immigrants | Western Europe | 86.6 /100 | #133 | Excellent 12.8% |
| Immigrants | Switzerland | 85.8 /100 | #134 | Excellent 12.9% |
| French | 85.6 /100 | #135 | Excellent 12.9% |
| Peruvians | 85.2 /100 | #136 | Excellent 12.9% |
| Chileans | 84.7 /100 | #137 | Excellent 12.9% |
| Immigrants | France | 83.6 /100 | #138 | Excellent 12.9% |
| Basques | 83.1 /100 | #139 | Excellent 12.9% |
| Pakistanis | 83.0 /100 | #140 | Excellent 12.9% |
| Icelanders | 81.1 /100 | #141 | Excellent 13.0% |
| Brazilians | 80.5 /100 | #142 | Excellent 13.0% |