Inupiat vs Tongan Poverty
COMPARE
Inupiat
Tongan
Poverty
Poverty Comparison
Inupiat
Tongans
15.1%
POVERTY
0.0/ 100
METRIC RATING
287th/ 347
METRIC RANK
10.8%
POVERTY
99.4/ 100
METRIC RATING
35th/ 347
METRIC RANK
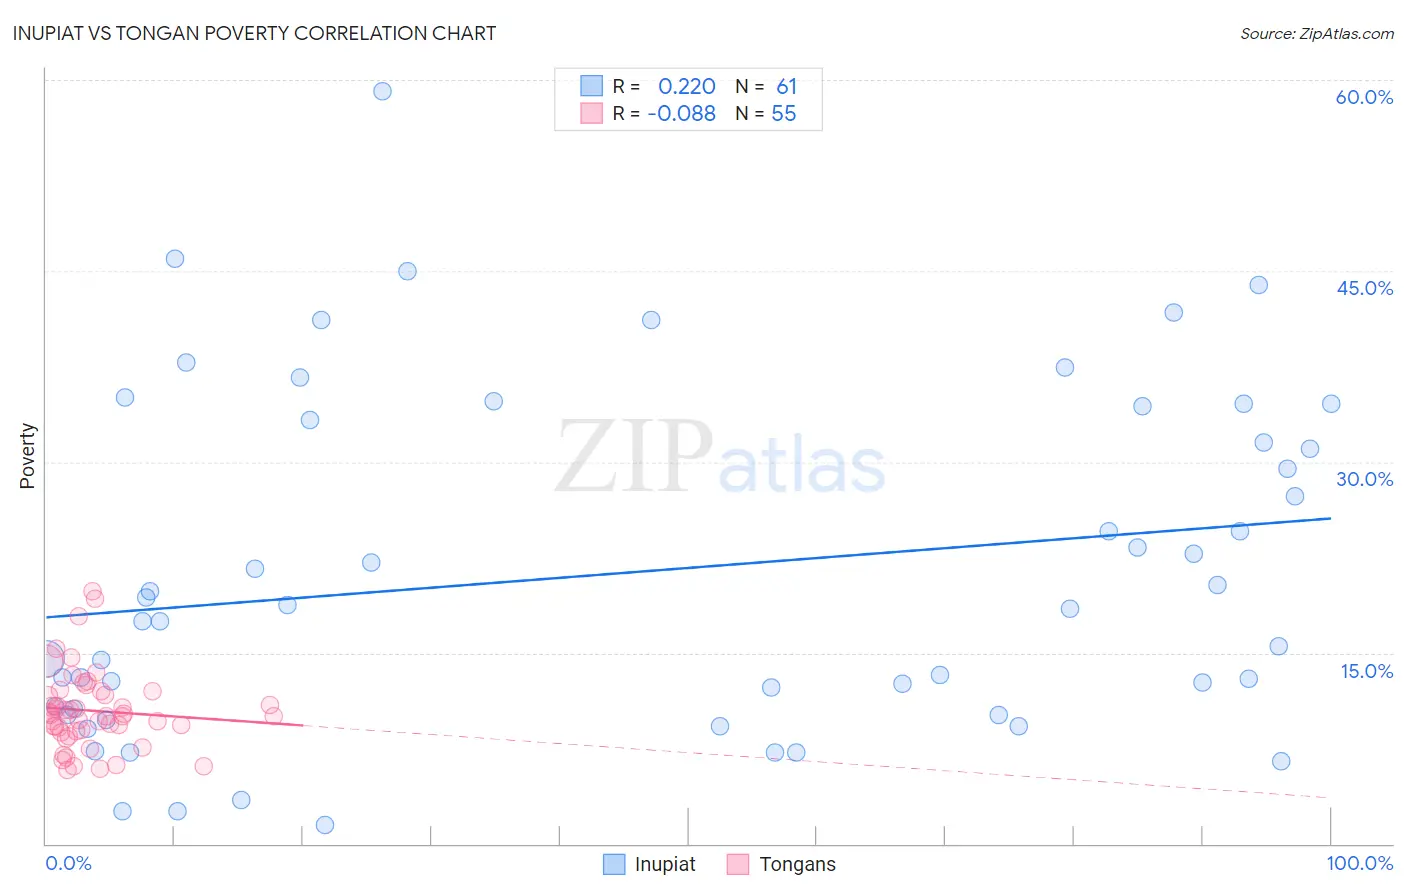
Inupiat vs Tongan Poverty Correlation Chart
The statistical analysis conducted on geographies consisting of 96,319,332 people shows a weak positive correlation between the proportion of Inupiat and poverty level in the United States with a correlation coefficient (R) of 0.220 and weighted average of 15.1%. Similarly, the statistical analysis conducted on geographies consisting of 102,864,002 people shows a slight negative correlation between the proportion of Tongans and poverty level in the United States with a correlation coefficient (R) of -0.088 and weighted average of 10.8%, a difference of 39.3%.
Poverty Correlation Summary
| Measurement | Inupiat | Tongan |
| Minimum | 1.4% | 5.8% |
| Maximum | 59.1% | 19.8% |
| Range | 57.7% | 14.1% |
| Mean | 21.3% | 10.4% |
| Median | 18.4% | 10.1% |
| Interquartile 25% (IQ1) | 10.3% | 8.8% |
| Interquartile 75% (IQ3) | 33.9% | 12.0% |
| Interquartile Range (IQR) | 23.5% | 3.1% |
| Standard Deviation (Sample) | 13.3% | 3.1% |
| Standard Deviation (Population) | 13.2% | 3.0% |
Similar Demographics by Poverty
Demographics Similar to Inupiat by Poverty
In terms of poverty, the demographic groups most similar to Inupiat are Yaqui (15.1%, a difference of 0.010%), Immigrants from Belize (15.1%, a difference of 0.13%), Immigrants from Latin America (15.0%, a difference of 0.21%), Mexican (15.1%, a difference of 0.23%), and Immigrants from Cabo Verde (15.1%, a difference of 0.36%).
| Demographics | Rating | Rank | Poverty |
| Haitians | 0.0 /100 | #280 | Tragic 14.9% |
| Immigrants | Barbados | 0.0 /100 | #281 | Tragic 14.9% |
| Comanche | 0.0 /100 | #282 | Tragic 15.0% |
| Immigrants | Haiti | 0.0 /100 | #283 | Tragic 15.0% |
| West Indians | 0.0 /100 | #284 | Tragic 15.0% |
| Vietnamese | 0.0 /100 | #285 | Tragic 15.0% |
| Immigrants | Latin America | 0.0 /100 | #286 | Tragic 15.0% |
| Inupiat | 0.0 /100 | #287 | Tragic 15.1% |
| Yaqui | 0.0 /100 | #288 | Tragic 15.1% |
| Immigrants | Belize | 0.0 /100 | #289 | Tragic 15.1% |
| Mexicans | 0.0 /100 | #290 | Tragic 15.1% |
| Immigrants | Cabo Verde | 0.0 /100 | #291 | Tragic 15.1% |
| Indonesians | 0.0 /100 | #292 | Tragic 15.1% |
| Immigrants | Zaire | 0.0 /100 | #293 | Tragic 15.1% |
| Blackfeet | 0.0 /100 | #294 | Tragic 15.2% |
Demographics Similar to Tongans by Poverty
In terms of poverty, the demographic groups most similar to Tongans are Immigrants from Poland (10.8%, a difference of 0.040%), Cypriot (10.8%, a difference of 0.080%), Macedonian (10.8%, a difference of 0.14%), Immigrants from Greece (10.8%, a difference of 0.17%), and Czech (10.8%, a difference of 0.22%).
| Demographics | Rating | Rank | Poverty |
| Immigrants | Korea | 99.5 /100 | #28 | Exceptional 10.7% |
| Greeks | 99.5 /100 | #29 | Exceptional 10.7% |
| Danes | 99.5 /100 | #30 | Exceptional 10.7% |
| Poles | 99.5 /100 | #31 | Exceptional 10.7% |
| Iranians | 99.5 /100 | #32 | Exceptional 10.7% |
| Macedonians | 99.4 /100 | #33 | Exceptional 10.8% |
| Immigrants | Poland | 99.4 /100 | #34 | Exceptional 10.8% |
| Tongans | 99.4 /100 | #35 | Exceptional 10.8% |
| Cypriots | 99.3 /100 | #36 | Exceptional 10.8% |
| Immigrants | Greece | 99.3 /100 | #37 | Exceptional 10.8% |
| Czechs | 99.3 /100 | #38 | Exceptional 10.8% |
| Immigrants | Pakistan | 99.3 /100 | #39 | Exceptional 10.8% |
| Russians | 99.3 /100 | #40 | Exceptional 10.9% |
| Immigrants | Iran | 99.2 /100 | #41 | Exceptional 10.9% |
| Koreans | 99.2 /100 | #42 | Exceptional 10.9% |