Soviet Union vs Guatemalan Poverty
COMPARE
Soviet Union
Guatemalan
Poverty
Poverty Comparison
Soviet Union
Guatemalans
11.7%
POVERTY
88.4/ 100
METRIC RATING
124th/ 347
METRIC RANK
15.3%
POVERTY
0.0/ 100
METRIC RATING
295th/ 347
METRIC RANK
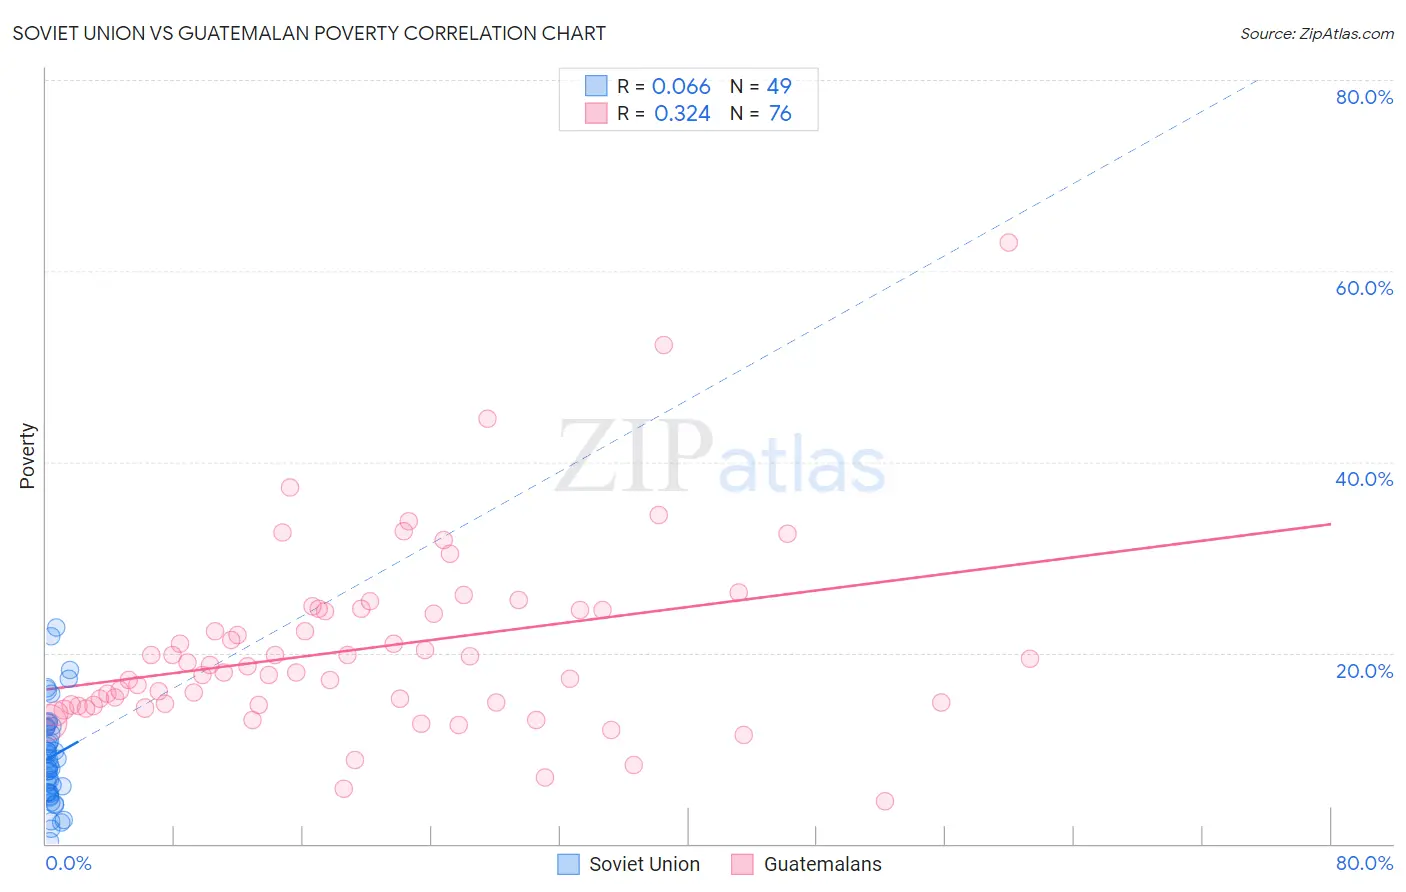
Soviet Union vs Guatemalan Poverty Correlation Chart
The statistical analysis conducted on geographies consisting of 43,449,399 people shows a slight positive correlation between the proportion of Soviet Union and poverty level in the United States with a correlation coefficient (R) of 0.066 and weighted average of 11.7%. Similarly, the statistical analysis conducted on geographies consisting of 409,295,647 people shows a mild positive correlation between the proportion of Guatemalans and poverty level in the United States with a correlation coefficient (R) of 0.324 and weighted average of 15.3%, a difference of 30.3%.
Poverty Correlation Summary
| Measurement | Soviet Union | Guatemalan |
| Minimum | 0.29% | 4.4% |
| Maximum | 22.6% | 62.9% |
| Range | 22.3% | 58.5% |
| Mean | 9.1% | 20.4% |
| Median | 8.3% | 18.3% |
| Interquartile 25% (IQ1) | 5.3% | 14.5% |
| Interquartile 75% (IQ3) | 12.3% | 24.5% |
| Interquartile Range (IQR) | 6.9% | 10.0% |
| Standard Deviation (Sample) | 5.0% | 9.7% |
| Standard Deviation (Population) | 5.0% | 9.6% |
Similar Demographics by Poverty
Demographics Similar to Soviet Union by Poverty
In terms of poverty, the demographic groups most similar to Soviet Union are Immigrants from Brazil (11.7%, a difference of 0.040%), Immigrants from Hungary (11.7%, a difference of 0.070%), Immigrants from Norway (11.7%, a difference of 0.080%), New Zealander (11.7%, a difference of 0.090%), and Puget Sound Salish (11.7%, a difference of 0.090%).
| Demographics | Rating | Rank | Poverty |
| Sri Lankans | 89.4 /100 | #117 | Excellent 11.7% |
| Argentineans | 89.1 /100 | #118 | Excellent 11.7% |
| Tlingit-Haida | 89.0 /100 | #119 | Excellent 11.7% |
| Immigrants | South Eastern Asia | 88.9 /100 | #120 | Excellent 11.7% |
| New Zealanders | 88.7 /100 | #121 | Excellent 11.7% |
| Puget Sound Salish | 88.7 /100 | #122 | Excellent 11.7% |
| Immigrants | Hungary | 88.6 /100 | #123 | Excellent 11.7% |
| Soviet Union | 88.4 /100 | #124 | Excellent 11.7% |
| Immigrants | Brazil | 88.2 /100 | #125 | Excellent 11.7% |
| Immigrants | Norway | 88.0 /100 | #126 | Excellent 11.7% |
| Immigrants | Argentina | 88.0 /100 | #127 | Excellent 11.7% |
| Immigrants | Israel | 87.4 /100 | #128 | Excellent 11.7% |
| South Africans | 87.0 /100 | #129 | Excellent 11.7% |
| Immigrants | Ukraine | 86.6 /100 | #130 | Excellent 11.8% |
| French | 86.1 /100 | #131 | Excellent 11.8% |
Demographics Similar to Guatemalans by Poverty
In terms of poverty, the demographic groups most similar to Guatemalans are Hispanic or Latino (15.3%, a difference of 0.010%), Immigrants from Bangladesh (15.3%, a difference of 0.050%), Immigrants from Senegal (15.3%, a difference of 0.20%), Senegalese (15.3%, a difference of 0.30%), and Blackfeet (15.2%, a difference of 0.42%).
| Demographics | Rating | Rank | Poverty |
| Yaqui | 0.0 /100 | #288 | Tragic 15.1% |
| Immigrants | Belize | 0.0 /100 | #289 | Tragic 15.1% |
| Mexicans | 0.0 /100 | #290 | Tragic 15.1% |
| Immigrants | Cabo Verde | 0.0 /100 | #291 | Tragic 15.1% |
| Indonesians | 0.0 /100 | #292 | Tragic 15.1% |
| Immigrants | Zaire | 0.0 /100 | #293 | Tragic 15.1% |
| Blackfeet | 0.0 /100 | #294 | Tragic 15.2% |
| Guatemalans | 0.0 /100 | #295 | Tragic 15.3% |
| Hispanics or Latinos | 0.0 /100 | #296 | Tragic 15.3% |
| Immigrants | Bangladesh | 0.0 /100 | #297 | Tragic 15.3% |
| Immigrants | Senegal | 0.0 /100 | #298 | Tragic 15.3% |
| Senegalese | 0.0 /100 | #299 | Tragic 15.3% |
| Immigrants | Central America | 0.0 /100 | #300 | Tragic 15.4% |
| Bahamians | 0.0 /100 | #301 | Tragic 15.4% |
| Somalis | 0.0 /100 | #302 | Tragic 15.4% |