Lumbee vs Guatemalan In Labor Force | Age 30-34
COMPARE
Lumbee
Guatemalan
In Labor Force | Age 30-34
In Labor Force | Age 30-34 Comparison
Lumbee
Guatemalans
77.3%
IN LABOR FORCE | AGE 30-34
0.0/ 100
METRIC RATING
343rd/ 347
METRIC RANK
83.7%
IN LABOR FORCE | AGE 30-34
0.2/ 100
METRIC RATING
264th/ 347
METRIC RANK
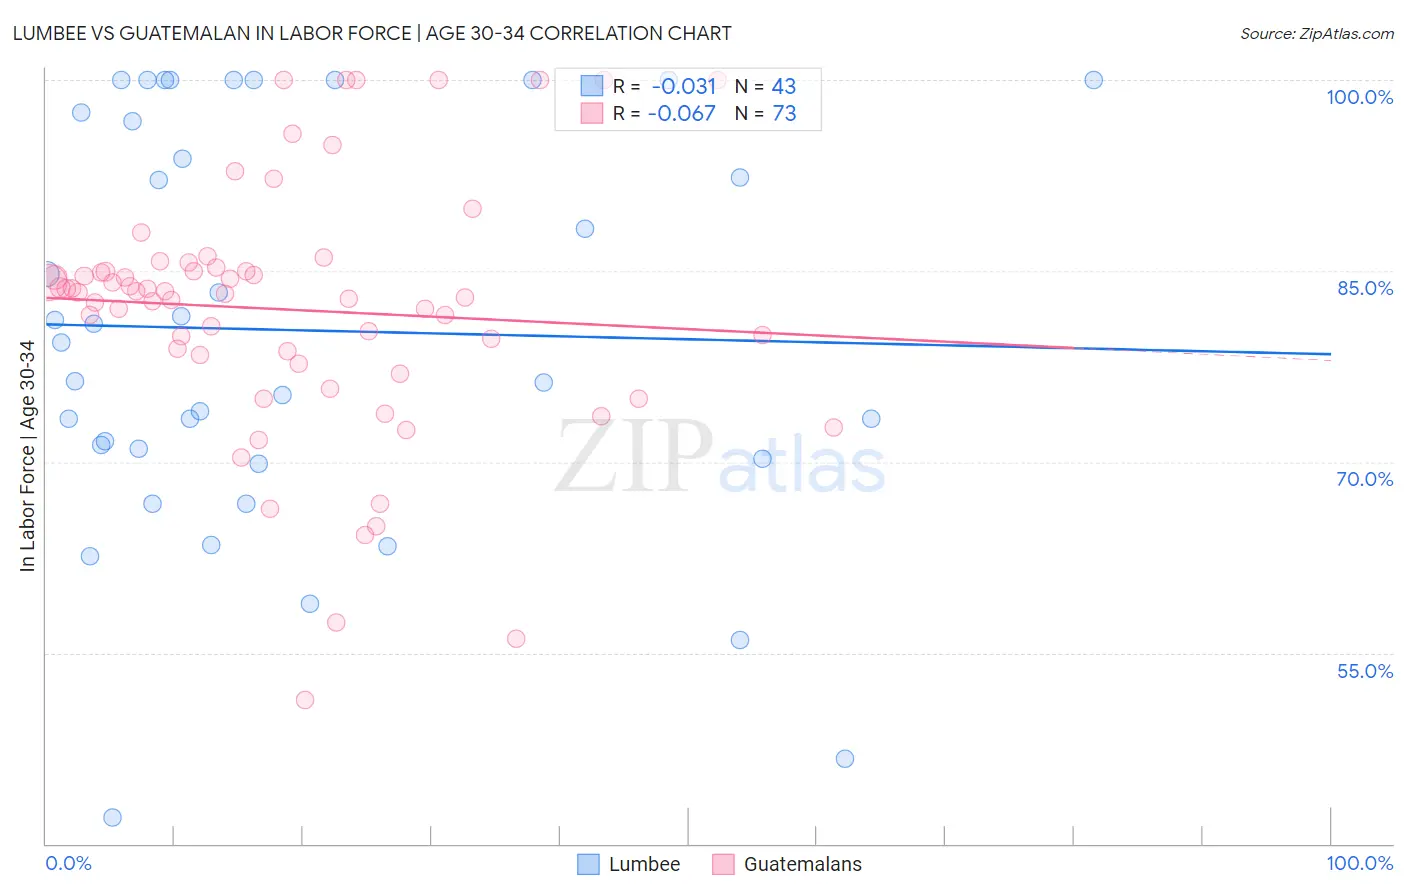
Lumbee vs Guatemalan In Labor Force | Age 30-34 Correlation Chart
The statistical analysis conducted on geographies consisting of 92,256,461 people shows no correlation between the proportion of Lumbee and labor force participation rate among population between the ages 30 and 34 in the United States with a correlation coefficient (R) of -0.031 and weighted average of 77.3%. Similarly, the statistical analysis conducted on geographies consisting of 409,343,950 people shows a slight negative correlation between the proportion of Guatemalans and labor force participation rate among population between the ages 30 and 34 in the United States with a correlation coefficient (R) of -0.067 and weighted average of 83.7%, a difference of 8.4%.
In Labor Force | Age 30-34 Correlation Summary
| Measurement | Lumbee | Guatemalan |
| Minimum | 42.1% | 51.3% |
| Maximum | 100.0% | 100.0% |
| Range | 57.9% | 48.7% |
| Mean | 80.3% | 82.0% |
| Median | 79.4% | 83.3% |
| Interquartile 25% (IQ1) | 70.2% | 78.0% |
| Interquartile 75% (IQ3) | 97.5% | 85.1% |
| Interquartile Range (IQR) | 27.2% | 7.1% |
| Standard Deviation (Sample) | 15.9% | 10.0% |
| Standard Deviation (Population) | 15.7% | 9.9% |
Similar Demographics by In Labor Force | Age 30-34
Demographics Similar to Lumbee by In Labor Force | Age 30-34
In terms of in labor force | age 30-34, the demographic groups most similar to Lumbee are Yuman (77.1%, a difference of 0.23%), Tohono O'odham (77.7%, a difference of 0.60%), Yup'ik (76.4%, a difference of 1.1%), Immigrants from Yemen (78.2%, a difference of 1.2%), and Crow (75.9%, a difference of 1.8%).
| Demographics | Rating | Rank | In Labor Force | Age 30-34 |
| Inupiat | 0.0 /100 | #333 | Tragic 79.7% |
| Hopi | 0.0 /100 | #334 | Tragic 79.3% |
| Marshallese | 0.0 /100 | #335 | Tragic 79.2% |
| Natives/Alaskans | 0.0 /100 | #336 | Tragic 79.2% |
| Yakama | 0.0 /100 | #337 | Tragic 79.1% |
| Pima | 0.0 /100 | #338 | Tragic 79.0% |
| Apache | 0.0 /100 | #339 | Tragic 79.0% |
| Ute | 0.0 /100 | #340 | Tragic 78.9% |
| Immigrants | Yemen | 0.0 /100 | #341 | Tragic 78.2% |
| Tohono O'odham | 0.0 /100 | #342 | Tragic 77.7% |
| Lumbee | 0.0 /100 | #343 | Tragic 77.3% |
| Yuman | 0.0 /100 | #344 | Tragic 77.1% |
| Yup'ik | 0.0 /100 | #345 | Tragic 76.4% |
| Crow | 0.0 /100 | #346 | Tragic 75.9% |
| Navajo | 0.0 /100 | #347 | Tragic 73.8% |
Demographics Similar to Guatemalans by In Labor Force | Age 30-34
In terms of in labor force | age 30-34, the demographic groups most similar to Guatemalans are Immigrants from Honduras (83.7%, a difference of 0.030%), Dominican (83.8%, a difference of 0.050%), Immigrants from Guyana (83.8%, a difference of 0.050%), Immigrants from Guatemala (83.7%, a difference of 0.050%), and Guyanese (83.8%, a difference of 0.070%).
| Demographics | Rating | Rank | In Labor Force | Age 30-34 |
| Iraqis | 0.3 /100 | #257 | Tragic 83.8% |
| Hondurans | 0.3 /100 | #258 | Tragic 83.8% |
| Scotch-Irish | 0.3 /100 | #259 | Tragic 83.8% |
| Immigrants | Dominican Republic | 0.3 /100 | #260 | Tragic 83.8% |
| Guyanese | 0.3 /100 | #261 | Tragic 83.8% |
| Dominicans | 0.2 /100 | #262 | Tragic 83.8% |
| Immigrants | Guyana | 0.2 /100 | #263 | Tragic 83.8% |
| Guatemalans | 0.2 /100 | #264 | Tragic 83.7% |
| Immigrants | Honduras | 0.1 /100 | #265 | Tragic 83.7% |
| Immigrants | Guatemala | 0.1 /100 | #266 | Tragic 83.7% |
| Spaniards | 0.1 /100 | #267 | Tragic 83.6% |
| Immigrants | Bangladesh | 0.1 /100 | #268 | Tragic 83.6% |
| Vietnamese | 0.1 /100 | #269 | Tragic 83.6% |
| Spanish Americans | 0.0 /100 | #270 | Tragic 83.5% |
| Spanish | 0.0 /100 | #271 | Tragic 83.5% |