Lithuanian vs Immigrants from Sudan Child Poverty Under the Age of 16
COMPARE
Lithuanian
Immigrants from Sudan
Child Poverty Under the Age of 16
Child Poverty Under the Age of 16 Comparison
Lithuanians
Immigrants from Sudan
13.5%
CHILD POVERTY UNDER THE AGE OF 16
99.6/ 100
METRIC RATING
35th/ 347
METRIC RANK
18.5%
CHILD POVERTY UNDER THE AGE OF 16
0.8/ 100
METRIC RATING
239th/ 347
METRIC RANK
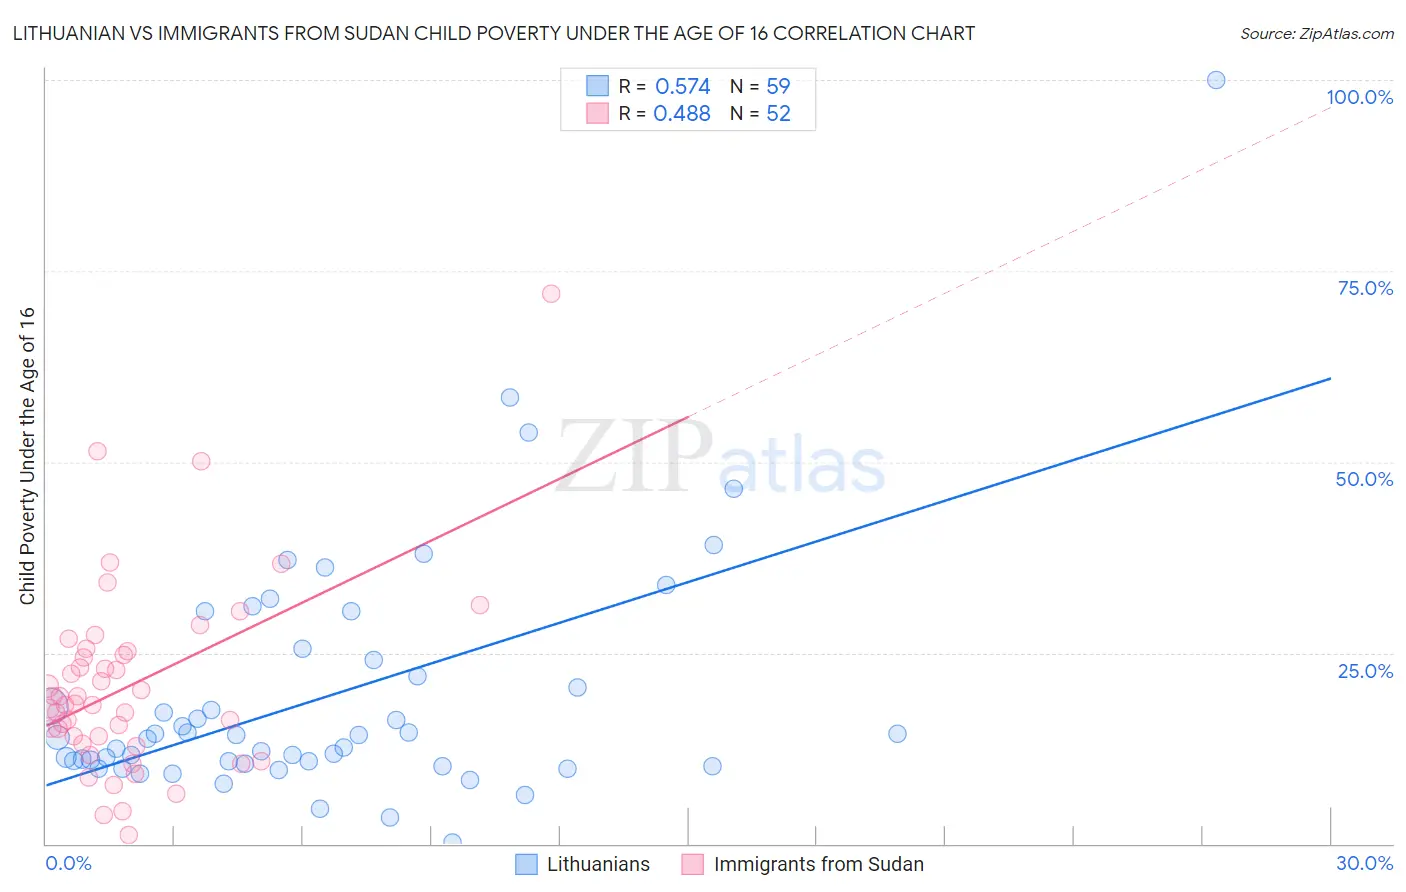
Lithuanian vs Immigrants from Sudan Child Poverty Under the Age of 16 Correlation Chart
The statistical analysis conducted on geographies consisting of 415,877,620 people shows a substantial positive correlation between the proportion of Lithuanians and poverty level among children under the age of 16 in the United States with a correlation coefficient (R) of 0.574 and weighted average of 13.5%. Similarly, the statistical analysis conducted on geographies consisting of 118,788,059 people shows a moderate positive correlation between the proportion of Immigrants from Sudan and poverty level among children under the age of 16 in the United States with a correlation coefficient (R) of 0.488 and weighted average of 18.5%, a difference of 37.1%.
Child Poverty Under the Age of 16 Correlation Summary
| Measurement | Lithuanian | Immigrants from Sudan |
| Minimum | 0.17% | 1.2% |
| Maximum | 100.0% | 71.9% |
| Range | 99.8% | 70.7% |
| Mean | 19.4% | 20.7% |
| Median | 13.9% | 18.2% |
| Interquartile 25% (IQ1) | 10.5% | 13.5% |
| Interquartile 75% (IQ3) | 24.0% | 25.0% |
| Interquartile Range (IQR) | 13.4% | 11.4% |
| Standard Deviation (Sample) | 16.2% | 12.5% |
| Standard Deviation (Population) | 16.1% | 12.4% |
Similar Demographics by Child Poverty Under the Age of 16
Demographics Similar to Lithuanians by Child Poverty Under the Age of 16
In terms of child poverty under the age of 16, the demographic groups most similar to Lithuanians are Russian (13.5%, a difference of 0.20%), Immigrants from Northern Europe (13.6%, a difference of 0.24%), Immigrants from Bolivia (13.6%, a difference of 0.26%), Asian (13.5%, a difference of 0.48%), and Luxembourger (13.6%, a difference of 0.77%).
| Demographics | Rating | Rank | Child Poverty Under the Age of 16 |
| Assyrians/Chaldeans/Syriacs | 99.7 /100 | #28 | Exceptional 13.3% |
| Swedes | 99.7 /100 | #29 | Exceptional 13.3% |
| Turks | 99.7 /100 | #30 | Exceptional 13.4% |
| Danes | 99.7 /100 | #31 | Exceptional 13.4% |
| Tongans | 99.7 /100 | #32 | Exceptional 13.4% |
| Asians | 99.6 /100 | #33 | Exceptional 13.5% |
| Russians | 99.6 /100 | #34 | Exceptional 13.5% |
| Lithuanians | 99.6 /100 | #35 | Exceptional 13.5% |
| Immigrants | Northern Europe | 99.6 /100 | #36 | Exceptional 13.6% |
| Immigrants | Bolivia | 99.6 /100 | #37 | Exceptional 13.6% |
| Luxembourgers | 99.5 /100 | #38 | Exceptional 13.6% |
| Immigrants | Australia | 99.5 /100 | #39 | Exceptional 13.6% |
| Immigrants | Scotland | 99.4 /100 | #40 | Exceptional 13.7% |
| Croatians | 99.4 /100 | #41 | Exceptional 13.8% |
| Immigrants | Sri Lanka | 99.3 /100 | #42 | Exceptional 13.8% |
Demographics Similar to Immigrants from Sudan by Child Poverty Under the Age of 16
In terms of child poverty under the age of 16, the demographic groups most similar to Immigrants from Sudan are Immigrants from Eritrea (18.5%, a difference of 0.040%), Ghanaian (18.6%, a difference of 0.050%), Sudanese (18.5%, a difference of 0.28%), Cree (18.5%, a difference of 0.31%), and Alsatian (18.6%, a difference of 0.51%).
| Demographics | Rating | Rank | Child Poverty Under the Age of 16 |
| Americans | 1.2 /100 | #232 | Tragic 18.3% |
| Fijians | 1.1 /100 | #233 | Tragic 18.4% |
| Immigrants | Nigeria | 1.0 /100 | #234 | Tragic 18.4% |
| Nigerians | 1.0 /100 | #235 | Tragic 18.4% |
| Cree | 0.9 /100 | #236 | Tragic 18.5% |
| Sudanese | 0.9 /100 | #237 | Tragic 18.5% |
| Immigrants | Eritrea | 0.8 /100 | #238 | Tragic 18.5% |
| Immigrants | Sudan | 0.8 /100 | #239 | Tragic 18.5% |
| Ghanaians | 0.8 /100 | #240 | Tragic 18.6% |
| Alsatians | 0.7 /100 | #241 | Tragic 18.6% |
| Immigrants | Laos | 0.6 /100 | #242 | Tragic 18.7% |
| Immigrants | Cuba | 0.6 /100 | #243 | Tragic 18.7% |
| Cape Verdeans | 0.6 /100 | #244 | Tragic 18.7% |
| Shoshone | 0.5 /100 | #245 | Tragic 18.8% |
| Immigrants | Nicaragua | 0.4 /100 | #246 | Tragic 18.8% |