Lithuanian vs Chippewa Male Poverty
COMPARE
Lithuanian
Chippewa
Male Poverty
Male Poverty Comparison
Lithuanians
Chippewa
9.5%
MALE POVERTY
99.8/ 100
METRIC RATING
18th/ 347
METRIC RANK
14.6%
MALE POVERTY
0.0/ 100
METRIC RATING
315th/ 347
METRIC RANK
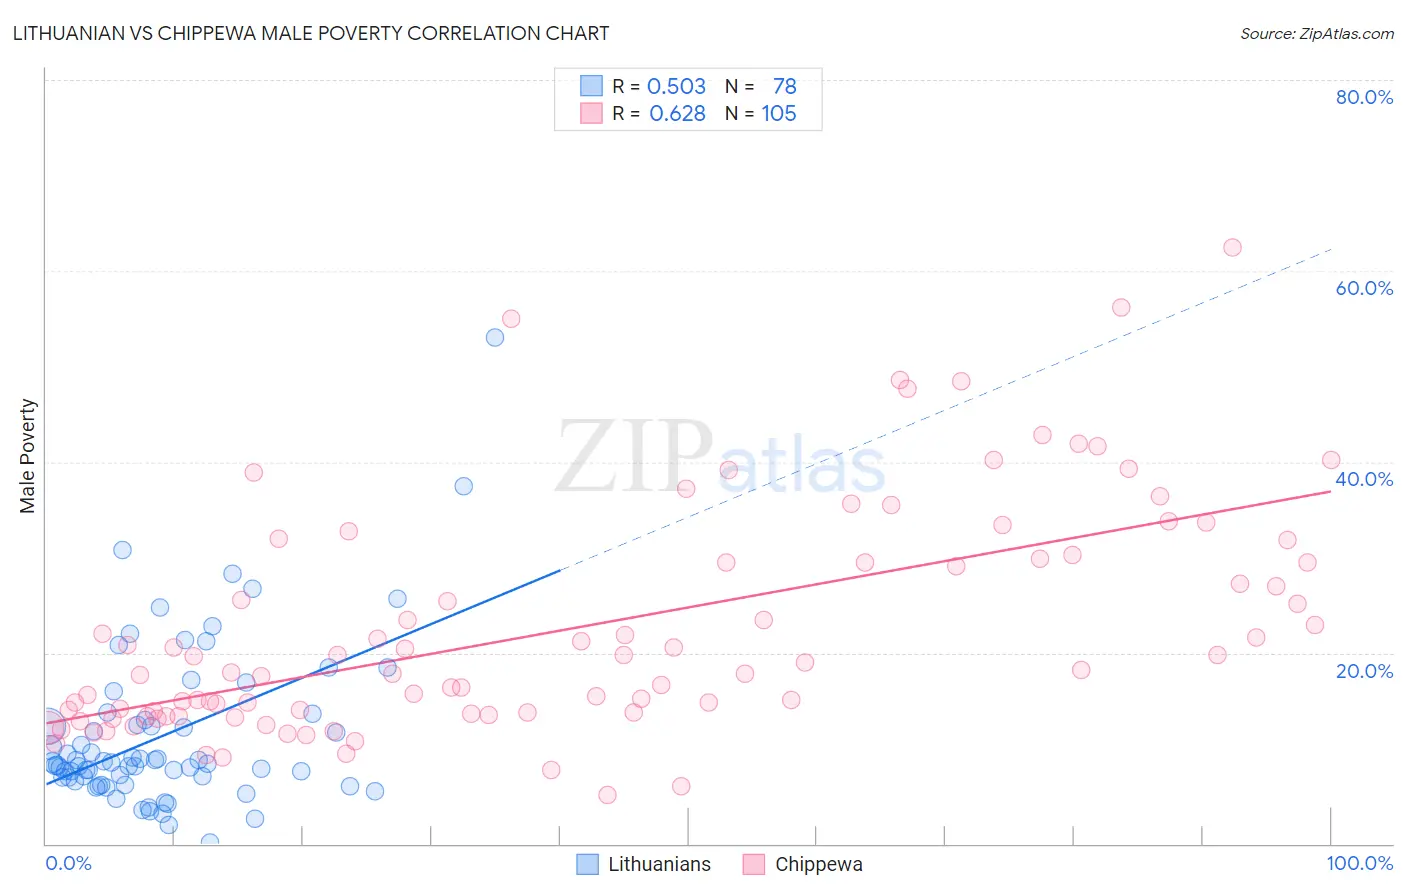
Lithuanian vs Chippewa Male Poverty Correlation Chart
The statistical analysis conducted on geographies consisting of 421,480,494 people shows a substantial positive correlation between the proportion of Lithuanians and poverty level among males in the United States with a correlation coefficient (R) of 0.503 and weighted average of 9.5%. Similarly, the statistical analysis conducted on geographies consisting of 214,985,801 people shows a significant positive correlation between the proportion of Chippewa and poverty level among males in the United States with a correlation coefficient (R) of 0.628 and weighted average of 14.6%, a difference of 52.9%.
Male Poverty Correlation Summary
| Measurement | Lithuanian | Chippewa |
| Minimum | 0.15% | 5.1% |
| Maximum | 53.0% | 62.5% |
| Range | 52.8% | 57.4% |
| Mean | 11.4% | 22.5% |
| Median | 8.5% | 18.2% |
| Interquartile 25% (IQ1) | 6.9% | 13.6% |
| Interquartile 75% (IQ3) | 13.0% | 29.7% |
| Interquartile Range (IQR) | 6.0% | 16.0% |
| Standard Deviation (Sample) | 8.6% | 12.0% |
| Standard Deviation (Population) | 8.6% | 11.9% |
Similar Demographics by Male Poverty
Demographics Similar to Lithuanians by Male Poverty
In terms of male poverty, the demographic groups most similar to Lithuanians are Norwegian (9.5%, a difference of 0.17%), Immigrants from Hong Kong (9.6%, a difference of 0.18%), Latvian (9.6%, a difference of 0.28%), Luxembourger (9.5%, a difference of 0.30%), and Immigrants from Scotland (9.6%, a difference of 0.55%).
| Demographics | Rating | Rank | Male Poverty |
| Bolivians | 99.9 /100 | #11 | Exceptional 9.4% |
| Immigrants | Bolivia | 99.9 /100 | #12 | Exceptional 9.4% |
| Immigrants | Lithuania | 99.9 /100 | #13 | Exceptional 9.4% |
| Immigrants | North Macedonia | 99.8 /100 | #14 | Exceptional 9.4% |
| Bhutanese | 99.8 /100 | #15 | Exceptional 9.5% |
| Luxembourgers | 99.8 /100 | #16 | Exceptional 9.5% |
| Norwegians | 99.8 /100 | #17 | Exceptional 9.5% |
| Lithuanians | 99.8 /100 | #18 | Exceptional 9.5% |
| Immigrants | Hong Kong | 99.7 /100 | #19 | Exceptional 9.6% |
| Latvians | 99.7 /100 | #20 | Exceptional 9.6% |
| Immigrants | Scotland | 99.7 /100 | #21 | Exceptional 9.6% |
| Croatians | 99.7 /100 | #22 | Exceptional 9.6% |
| Italians | 99.7 /100 | #23 | Exceptional 9.6% |
| Swedes | 99.7 /100 | #24 | Exceptional 9.6% |
| Eastern Europeans | 99.6 /100 | #25 | Exceptional 9.6% |
Demographics Similar to Chippewa by Male Poverty
In terms of male poverty, the demographic groups most similar to Chippewa are British West Indian (14.6%, a difference of 0.020%), Immigrants from Honduras (14.6%, a difference of 0.080%), Immigrants from Somalia (14.6%, a difference of 0.11%), Immigrants from Dominica (14.7%, a difference of 0.70%), and Immigrants from Grenada (14.7%, a difference of 0.76%).
| Demographics | Rating | Rank | Male Poverty |
| Africans | 0.0 /100 | #308 | Tragic 14.2% |
| Somalis | 0.0 /100 | #309 | Tragic 14.3% |
| Seminole | 0.0 /100 | #310 | Tragic 14.3% |
| Hondurans | 0.0 /100 | #311 | Tragic 14.3% |
| Choctaw | 0.0 /100 | #312 | Tragic 14.4% |
| Immigrants | Somalia | 0.0 /100 | #313 | Tragic 14.6% |
| Immigrants | Honduras | 0.0 /100 | #314 | Tragic 14.6% |
| Chippewa | 0.0 /100 | #315 | Tragic 14.6% |
| British West Indians | 0.0 /100 | #316 | Tragic 14.6% |
| Immigrants | Dominica | 0.0 /100 | #317 | Tragic 14.7% |
| Immigrants | Grenada | 0.0 /100 | #318 | Tragic 14.7% |
| U.S. Virgin Islanders | 0.0 /100 | #319 | Tragic 14.7% |
| Immigrants | Congo | 0.0 /100 | #320 | Tragic 14.7% |
| Arapaho | 0.0 /100 | #321 | Tragic 15.1% |
| Kiowa | 0.0 /100 | #322 | Tragic 15.2% |