Lithuanian vs Bermudan Male Poverty
COMPARE
Lithuanian
Bermudan
Male Poverty
Male Poverty Comparison
Lithuanians
Bermudans
9.5%
MALE POVERTY
99.8/ 100
METRIC RATING
18th/ 347
METRIC RANK
12.2%
MALE POVERTY
2.4/ 100
METRIC RATING
219th/ 347
METRIC RANK
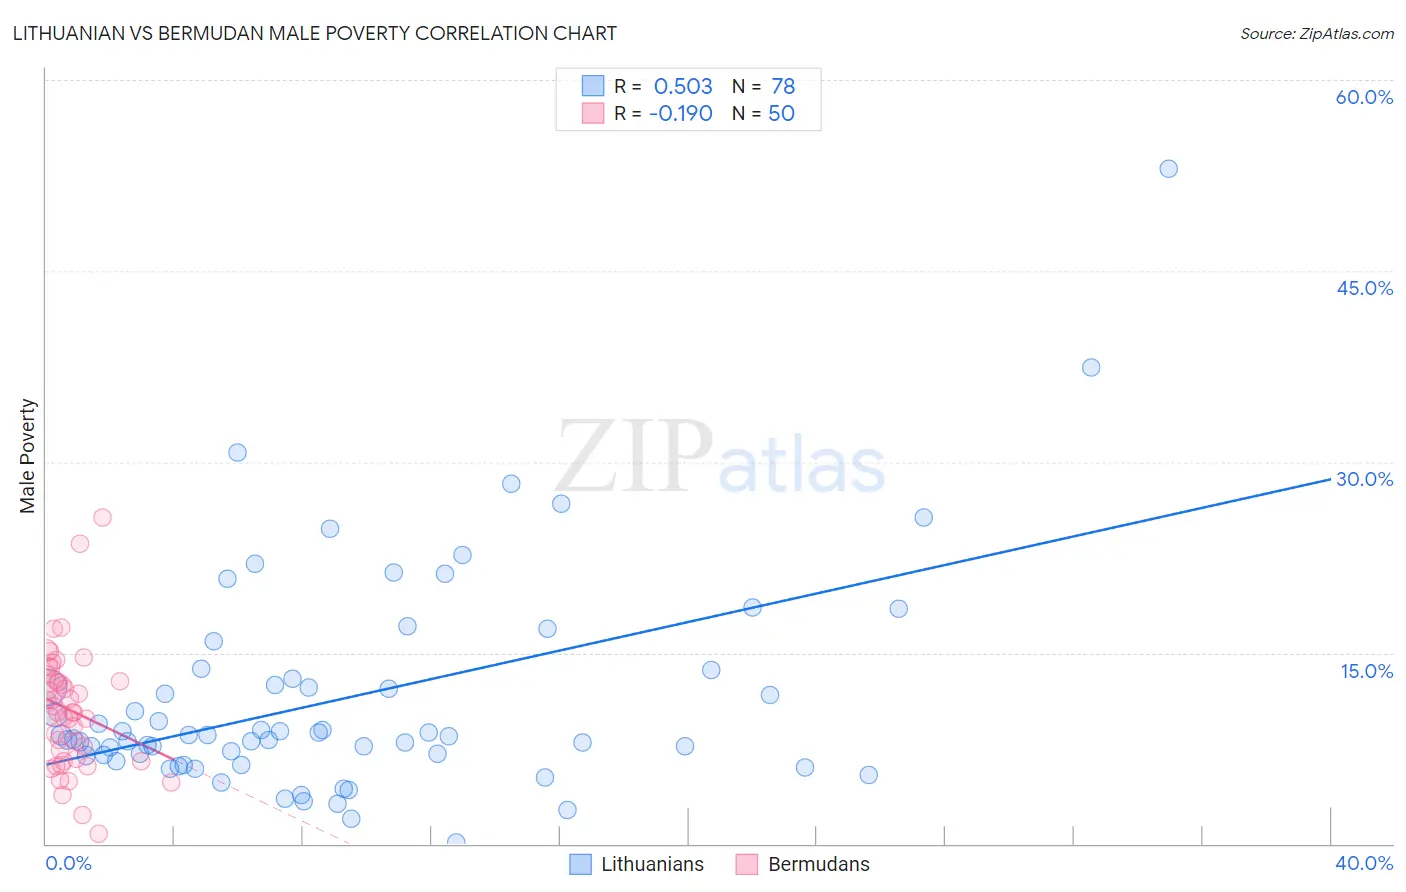
Lithuanian vs Bermudan Male Poverty Correlation Chart
The statistical analysis conducted on geographies consisting of 421,480,494 people shows a substantial positive correlation between the proportion of Lithuanians and poverty level among males in the United States with a correlation coefficient (R) of 0.503 and weighted average of 9.5%. Similarly, the statistical analysis conducted on geographies consisting of 55,715,607 people shows a poor negative correlation between the proportion of Bermudans and poverty level among males in the United States with a correlation coefficient (R) of -0.190 and weighted average of 12.2%, a difference of 27.9%.
Male Poverty Correlation Summary
| Measurement | Lithuanian | Bermudan |
| Minimum | 0.15% | 0.81% |
| Maximum | 53.0% | 25.6% |
| Range | 52.8% | 24.8% |
| Mean | 11.4% | 10.5% |
| Median | 8.5% | 10.3% |
| Interquartile 25% (IQ1) | 6.9% | 6.7% |
| Interquartile 75% (IQ3) | 13.0% | 12.9% |
| Interquartile Range (IQR) | 6.0% | 6.2% |
| Standard Deviation (Sample) | 8.6% | 4.7% |
| Standard Deviation (Population) | 8.6% | 4.7% |
Similar Demographics by Male Poverty
Demographics Similar to Lithuanians by Male Poverty
In terms of male poverty, the demographic groups most similar to Lithuanians are Norwegian (9.5%, a difference of 0.17%), Immigrants from Hong Kong (9.6%, a difference of 0.18%), Latvian (9.6%, a difference of 0.28%), Luxembourger (9.5%, a difference of 0.30%), and Immigrants from Scotland (9.6%, a difference of 0.55%).
| Demographics | Rating | Rank | Male Poverty |
| Bolivians | 99.9 /100 | #11 | Exceptional 9.4% |
| Immigrants | Bolivia | 99.9 /100 | #12 | Exceptional 9.4% |
| Immigrants | Lithuania | 99.9 /100 | #13 | Exceptional 9.4% |
| Immigrants | North Macedonia | 99.8 /100 | #14 | Exceptional 9.4% |
| Bhutanese | 99.8 /100 | #15 | Exceptional 9.5% |
| Luxembourgers | 99.8 /100 | #16 | Exceptional 9.5% |
| Norwegians | 99.8 /100 | #17 | Exceptional 9.5% |
| Lithuanians | 99.8 /100 | #18 | Exceptional 9.5% |
| Immigrants | Hong Kong | 99.7 /100 | #19 | Exceptional 9.6% |
| Latvians | 99.7 /100 | #20 | Exceptional 9.6% |
| Immigrants | Scotland | 99.7 /100 | #21 | Exceptional 9.6% |
| Croatians | 99.7 /100 | #22 | Exceptional 9.6% |
| Italians | 99.7 /100 | #23 | Exceptional 9.6% |
| Swedes | 99.7 /100 | #24 | Exceptional 9.6% |
| Eastern Europeans | 99.6 /100 | #25 | Exceptional 9.6% |
Demographics Similar to Bermudans by Male Poverty
In terms of male poverty, the demographic groups most similar to Bermudans are Immigrants from Eritrea (12.2%, a difference of 0.020%), German Russian (12.2%, a difference of 0.070%), Immigrants from Thailand (12.2%, a difference of 0.090%), Immigrants from Cambodia (12.2%, a difference of 0.10%), and Immigrants from Uzbekistan (12.2%, a difference of 0.18%).
| Demographics | Rating | Rank | Male Poverty |
| Americans | 3.2 /100 | #212 | Tragic 12.1% |
| Immigrants | Nonimmigrants | 3.1 /100 | #213 | Tragic 12.1% |
| Japanese | 2.7 /100 | #214 | Tragic 12.2% |
| Immigrants | Uzbekistan | 2.6 /100 | #215 | Tragic 12.2% |
| Immigrants | Cambodia | 2.5 /100 | #216 | Tragic 12.2% |
| Immigrants | Thailand | 2.5 /100 | #217 | Tragic 12.2% |
| German Russians | 2.5 /100 | #218 | Tragic 12.2% |
| Bermudans | 2.4 /100 | #219 | Tragic 12.2% |
| Immigrants | Eritrea | 2.4 /100 | #220 | Tragic 12.2% |
| Ugandans | 2.2 /100 | #221 | Tragic 12.2% |
| Immigrants | Africa | 2.1 /100 | #222 | Tragic 12.2% |
| Immigrants | Micronesia | 2.1 /100 | #223 | Tragic 12.2% |
| Immigrants | Nigeria | 1.6 /100 | #224 | Tragic 12.3% |
| Osage | 1.5 /100 | #225 | Tragic 12.3% |
| Nigerians | 1.4 /100 | #226 | Tragic 12.3% |