Lithuanian vs Immigrants from Sudan College, Under 1 year
COMPARE
Lithuanian
Immigrants from Sudan
College, Under 1 year
College, Under 1 year Comparison
Lithuanians
Immigrants from Sudan
68.8%
COLLEGE, UNDER 1 YEAR
99.1/ 100
METRIC RATING
70th/ 347
METRIC RANK
66.2%
COLLEGE, UNDER 1 YEAR
76.0/ 100
METRIC RATING
151st/ 347
METRIC RANK
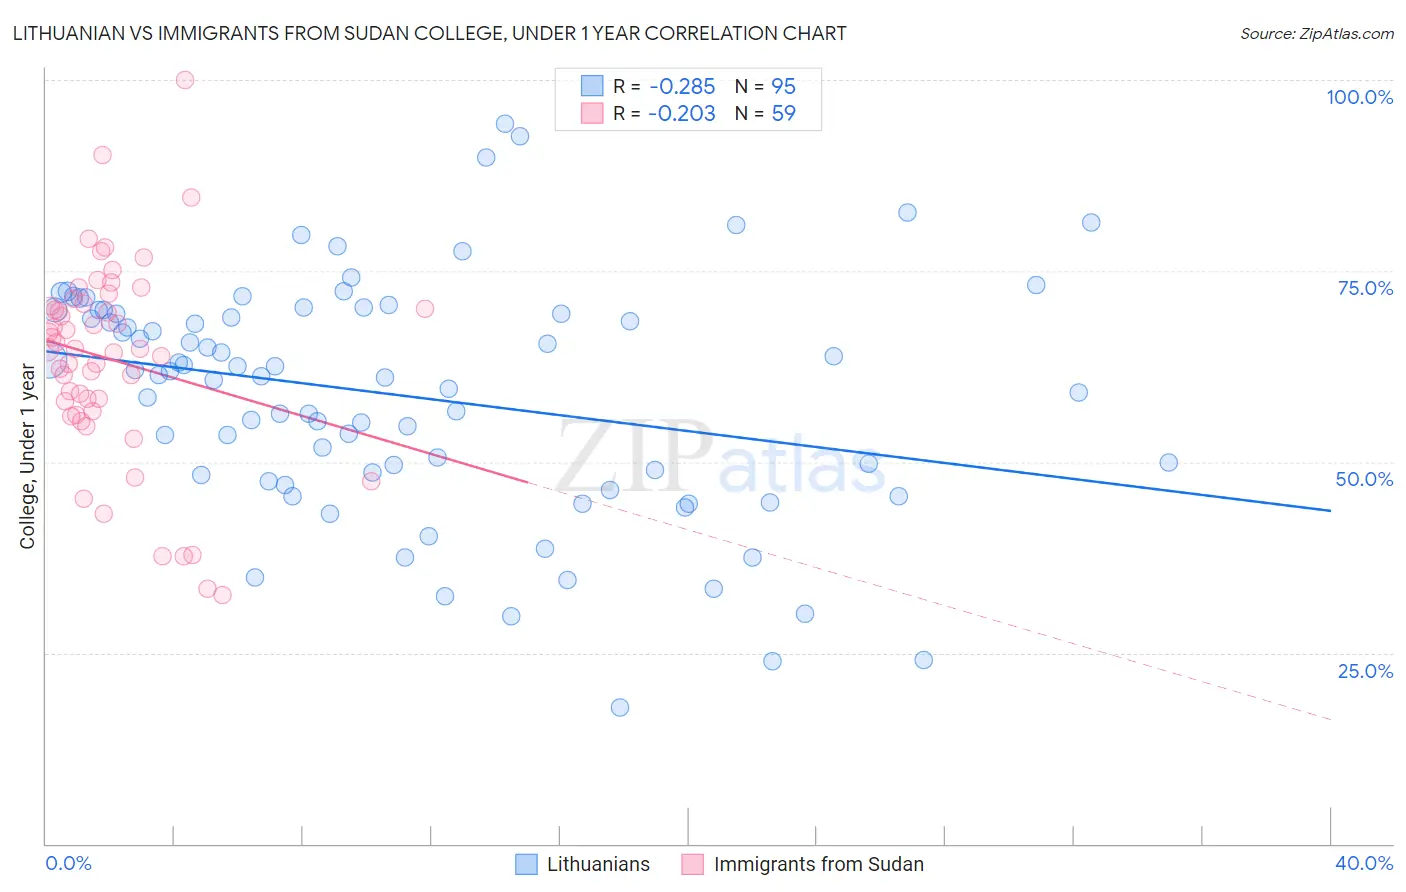
Lithuanian vs Immigrants from Sudan College, Under 1 year Correlation Chart
The statistical analysis conducted on geographies consisting of 421,945,677 people shows a weak negative correlation between the proportion of Lithuanians and percentage of population with at least college, under 1 year education in the United States with a correlation coefficient (R) of -0.285 and weighted average of 68.8%. Similarly, the statistical analysis conducted on geographies consisting of 118,973,526 people shows a weak negative correlation between the proportion of Immigrants from Sudan and percentage of population with at least college, under 1 year education in the United States with a correlation coefficient (R) of -0.203 and weighted average of 66.2%, a difference of 3.8%.
College, Under 1 year Correlation Summary
| Measurement | Lithuanian | Immigrants from Sudan |
| Minimum | 17.9% | 32.5% |
| Maximum | 94.2% | 100.0% |
| Range | 76.4% | 67.5% |
| Mean | 58.7% | 63.4% |
| Median | 61.4% | 64.8% |
| Interquartile 25% (IQ1) | 48.2% | 56.6% |
| Interquartile 75% (IQ3) | 69.9% | 70.7% |
| Interquartile Range (IQR) | 21.6% | 14.1% |
| Standard Deviation (Sample) | 15.4% | 13.2% |
| Standard Deviation (Population) | 15.4% | 13.0% |
Similar Demographics by College, Under 1 year
Demographics Similar to Lithuanians by College, Under 1 year
In terms of college, under 1 year, the demographic groups most similar to Lithuanians are Immigrants from Europe (68.8%, a difference of 0.010%), Bolivian (68.7%, a difference of 0.060%), Immigrants from England (68.7%, a difference of 0.090%), Swedish (68.7%, a difference of 0.15%), and Immigrants from Romania (68.9%, a difference of 0.16%).
| Demographics | Rating | Rank | College, Under 1 year |
| Immigrants | Canada | 99.4 /100 | #63 | Exceptional 69.1% |
| Northern Europeans | 99.4 /100 | #64 | Exceptional 69.0% |
| Immigrants | Moldova | 99.3 /100 | #65 | Exceptional 69.0% |
| Immigrants | North America | 99.3 /100 | #66 | Exceptional 69.0% |
| Immigrants | Zimbabwe | 99.2 /100 | #67 | Exceptional 68.9% |
| Immigrants | Indonesia | 99.2 /100 | #68 | Exceptional 68.9% |
| Immigrants | Romania | 99.2 /100 | #69 | Exceptional 68.9% |
| Lithuanians | 99.1 /100 | #70 | Exceptional 68.8% |
| Immigrants | Europe | 99.1 /100 | #71 | Exceptional 68.8% |
| Bolivians | 99.0 /100 | #72 | Exceptional 68.7% |
| Immigrants | England | 99.0 /100 | #73 | Exceptional 68.7% |
| Swedes | 98.9 /100 | #74 | Exceptional 68.7% |
| Immigrants | Western Europe | 98.6 /100 | #75 | Exceptional 68.5% |
| Laotians | 98.6 /100 | #76 | Exceptional 68.5% |
| British | 98.6 /100 | #77 | Exceptional 68.5% |
Demographics Similar to Immigrants from Sudan by College, Under 1 year
In terms of college, under 1 year, the demographic groups most similar to Immigrants from Sudan are Immigrants from Iraq (66.3%, a difference of 0.070%), Sudanese (66.2%, a difference of 0.11%), Immigrants from Venezuela (66.3%, a difference of 0.12%), Belgian (66.2%, a difference of 0.13%), and Taiwanese (66.4%, a difference of 0.16%).
| Demographics | Rating | Rank | College, Under 1 year |
| Immigrants | Germany | 82.0 /100 | #144 | Excellent 66.5% |
| Immigrants | Kenya | 81.8 /100 | #145 | Excellent 66.5% |
| Kenyans | 81.7 /100 | #146 | Excellent 66.5% |
| Immigrants | Morocco | 81.7 /100 | #147 | Excellent 66.5% |
| Taiwanese | 78.6 /100 | #148 | Good 66.4% |
| Immigrants | Venezuela | 77.9 /100 | #149 | Good 66.3% |
| Immigrants | Iraq | 77.1 /100 | #150 | Good 66.3% |
| Immigrants | Sudan | 76.0 /100 | #151 | Good 66.2% |
| Sudanese | 74.1 /100 | #152 | Good 66.2% |
| Belgians | 73.7 /100 | #153 | Good 66.2% |
| Immigrants | Eritrea | 71.9 /100 | #154 | Good 66.1% |
| Irish | 70.3 /100 | #155 | Good 66.0% |
| Welsh | 69.9 /100 | #156 | Good 66.0% |
| Sierra Leoneans | 67.8 /100 | #157 | Good 66.0% |
| Celtics | 67.3 /100 | #158 | Good 65.9% |