Lithuanian vs Immigrants from Sudan Family Households
COMPARE
Lithuanian
Immigrants from Sudan
Family Households
Family Households Comparison
Lithuanians
Immigrants from Sudan
64.0%
FAMILY HOUSEHOLDS
23.8/ 100
METRIC RATING
192nd/ 347
METRIC RANK
60.2%
FAMILY HOUSEHOLDS
0.0/ 100
METRIC RATING
340th/ 347
METRIC RANK
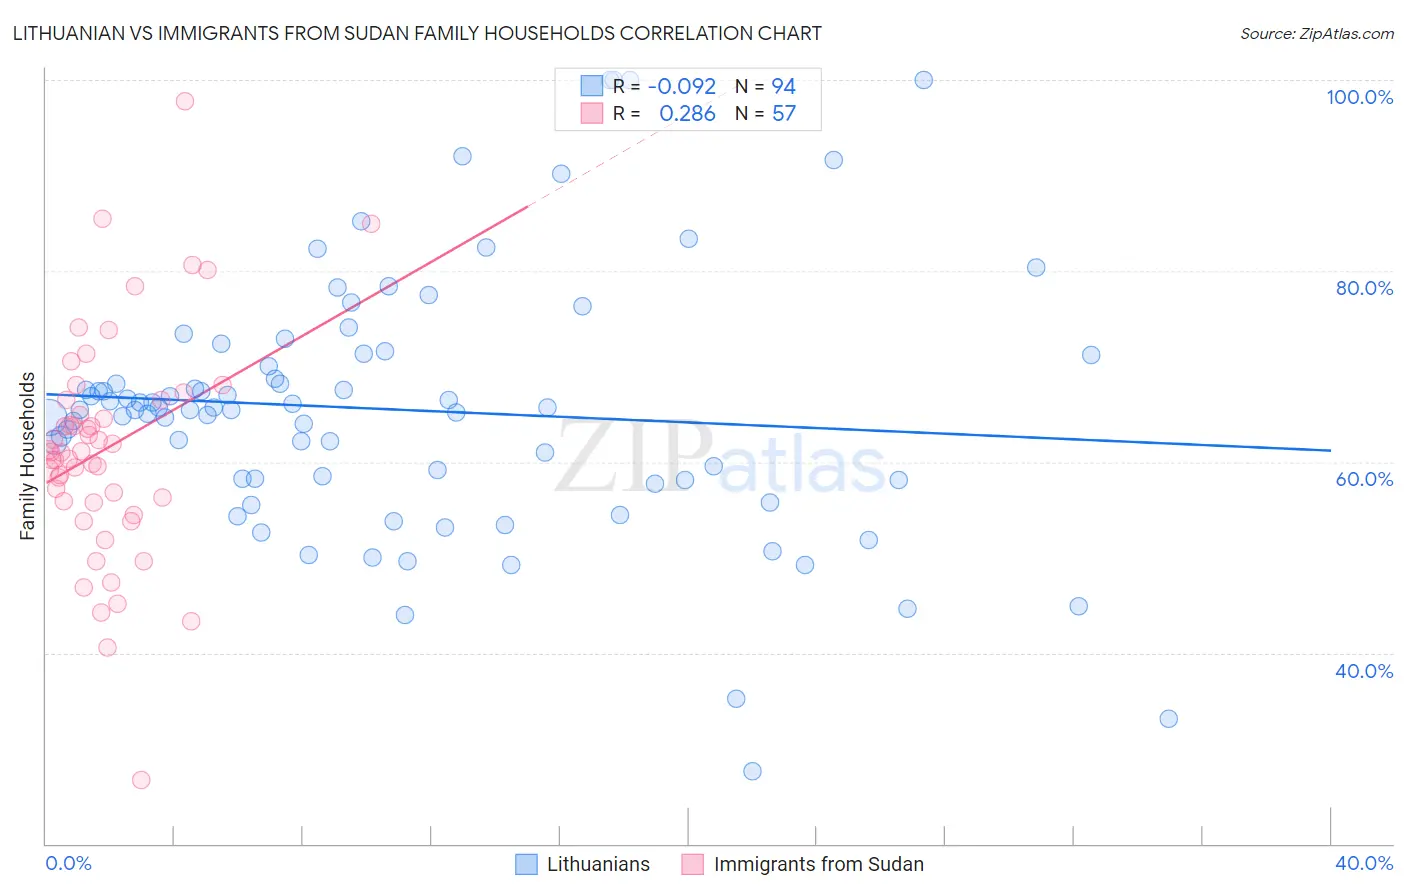
Lithuanian vs Immigrants from Sudan Family Households Correlation Chart
The statistical analysis conducted on geographies consisting of 421,743,433 people shows a slight negative correlation between the proportion of Lithuanians and percentage of family households in the United States with a correlation coefficient (R) of -0.092 and weighted average of 64.0%. Similarly, the statistical analysis conducted on geographies consisting of 118,943,916 people shows a weak positive correlation between the proportion of Immigrants from Sudan and percentage of family households in the United States with a correlation coefficient (R) of 0.286 and weighted average of 60.2%, a difference of 6.5%.
Family Households Correlation Summary
| Measurement | Lithuanian | Immigrants from Sudan |
| Minimum | 27.6% | 26.6% |
| Maximum | 100.0% | 97.8% |
| Range | 72.4% | 71.1% |
| Mean | 65.5% | 61.4% |
| Median | 65.5% | 61.0% |
| Interquartile 25% (IQ1) | 58.1% | 55.8% |
| Interquartile 75% (IQ3) | 71.3% | 66.4% |
| Interquartile Range (IQR) | 13.1% | 10.6% |
| Standard Deviation (Sample) | 13.6% | 11.8% |
| Standard Deviation (Population) | 13.6% | 11.7% |
Similar Demographics by Family Households
Demographics Similar to Lithuanians by Family Households
In terms of family households, the demographic groups most similar to Lithuanians are French (64.0%, a difference of 0.0%), Arab (64.1%, a difference of 0.010%), Zimbabwean (64.1%, a difference of 0.020%), Immigrants from Western Asia (64.1%, a difference of 0.030%), and Paiute (64.0%, a difference of 0.030%).
| Demographics | Rating | Rank | Family Households |
| Immigrants | Iran | 30.4 /100 | #185 | Fair 64.1% |
| Spanish Americans | 30.1 /100 | #186 | Fair 64.1% |
| Northern Europeans | 28.2 /100 | #187 | Fair 64.1% |
| Paraguayans | 26.7 /100 | #188 | Fair 64.1% |
| Immigrants | Western Asia | 25.3 /100 | #189 | Fair 64.1% |
| Zimbabweans | 24.7 /100 | #190 | Fair 64.1% |
| Arabs | 24.5 /100 | #191 | Fair 64.1% |
| Lithuanians | 23.8 /100 | #192 | Fair 64.0% |
| French | 23.7 /100 | #193 | Fair 64.0% |
| Paiute | 22.2 /100 | #194 | Fair 64.0% |
| Immigrants | North America | 20.0 /100 | #195 | Poor 64.0% |
| Immigrants | Canada | 19.2 /100 | #196 | Poor 64.0% |
| Seminole | 18.9 /100 | #197 | Poor 64.0% |
| Poles | 18.9 /100 | #198 | Poor 64.0% |
| Slavs | 18.6 /100 | #199 | Poor 64.0% |
Demographics Similar to Immigrants from Sudan by Family Households
In terms of family households, the demographic groups most similar to Immigrants from Sudan are Immigrants from Senegal (60.1%, a difference of 0.080%), Sudanese (60.0%, a difference of 0.27%), Senegalese (59.8%, a difference of 0.57%), Immigrants from Saudi Arabia (60.7%, a difference of 0.89%), and Immigrants from Eritrea (60.8%, a difference of 1.1%).
| Demographics | Rating | Rank | Family Households |
| Immigrants | Ethiopia | 0.0 /100 | #333 | Tragic 61.2% |
| Immigrants | Eastern Africa | 0.0 /100 | #334 | Tragic 61.1% |
| Carpatho Rusyns | 0.0 /100 | #335 | Tragic 61.1% |
| German Russians | 0.0 /100 | #336 | Tragic 60.9% |
| Soviet Union | 0.0 /100 | #337 | Tragic 60.9% |
| Immigrants | Eritrea | 0.0 /100 | #338 | Tragic 60.8% |
| Immigrants | Saudi Arabia | 0.0 /100 | #339 | Tragic 60.7% |
| Immigrants | Sudan | 0.0 /100 | #340 | Tragic 60.2% |
| Immigrants | Senegal | 0.0 /100 | #341 | Tragic 60.1% |
| Sudanese | 0.0 /100 | #342 | Tragic 60.0% |
| Senegalese | 0.0 /100 | #343 | Tragic 59.8% |
| Immigrants | Congo | 0.0 /100 | #344 | Tragic 59.2% |
| Immigrants | Zaire | 0.0 /100 | #345 | Tragic 59.2% |
| Somalis | 0.0 /100 | #346 | Tragic 57.6% |
| Immigrants | Somalia | 0.0 /100 | #347 | Tragic 56.7% |