Korean vs Trinidadian and Tobagonian Single Male Poverty
COMPARE
Korean
Trinidadian and Tobagonian
Single Male Poverty
Single Male Poverty Comparison
Koreans
Trinidadians and Tobagonians
11.0%
SINGLE MALE POVERTY
100.0/ 100
METRIC RATING
15th/ 347
METRIC RANK
13.0%
SINGLE MALE POVERTY
21.4/ 100
METRIC RATING
201st/ 347
METRIC RANK
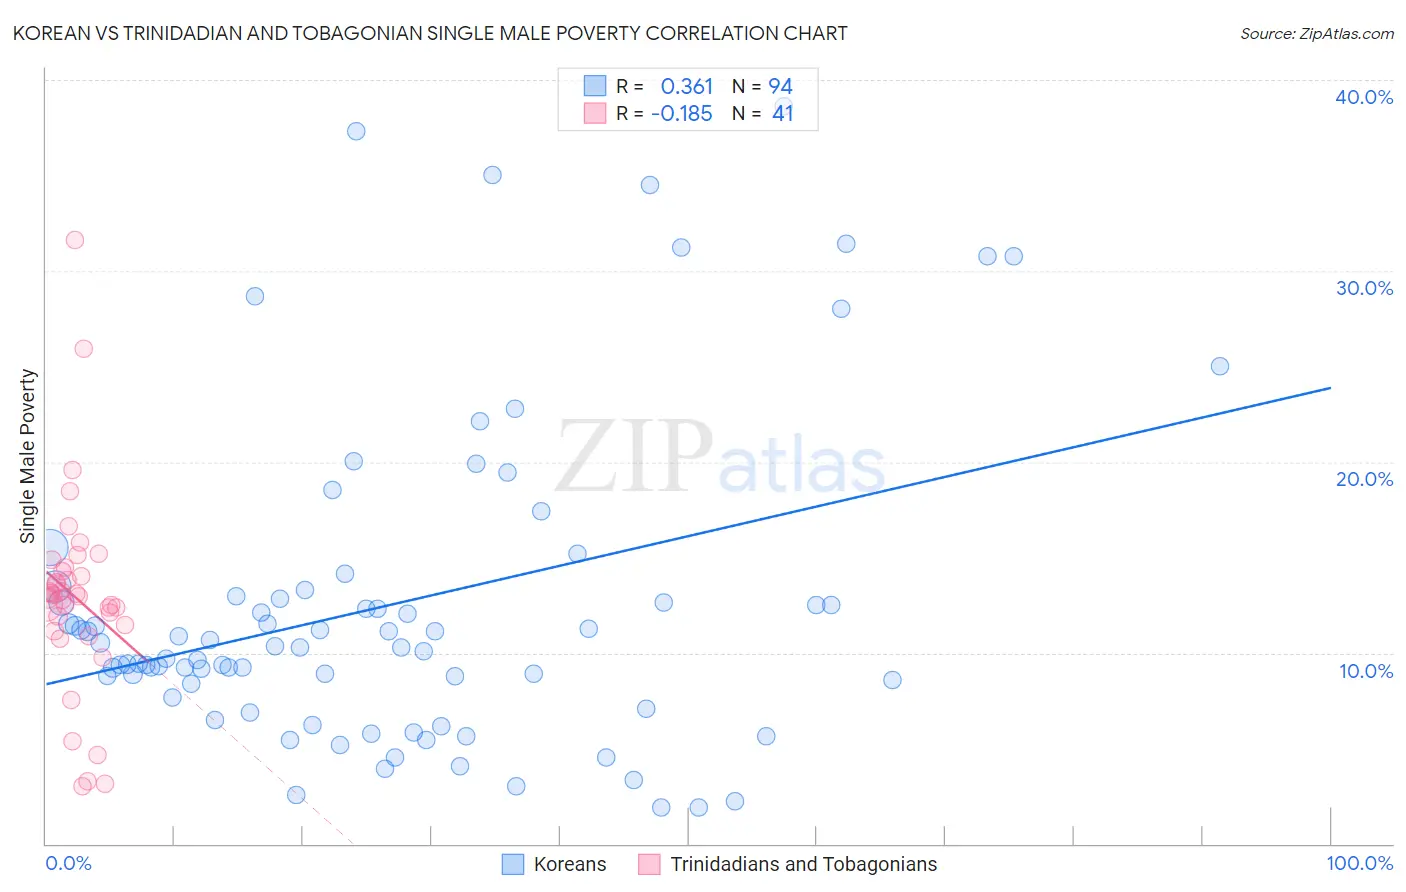
Korean vs Trinidadian and Tobagonian Single Male Poverty Correlation Chart
The statistical analysis conducted on geographies consisting of 437,940,785 people shows a mild positive correlation between the proportion of Koreans and poverty level among single males in the United States with a correlation coefficient (R) of 0.361 and weighted average of 11.0%. Similarly, the statistical analysis conducted on geographies consisting of 204,213,293 people shows a poor negative correlation between the proportion of Trinidadians and Tobagonians and poverty level among single males in the United States with a correlation coefficient (R) of -0.185 and weighted average of 13.0%, a difference of 18.5%.
Single Male Poverty Correlation Summary
| Measurement | Korean | Trinidadian and Tobagonian |
| Minimum | 1.9% | 3.0% |
| Maximum | 38.6% | 31.6% |
| Range | 36.8% | 28.6% |
| Mean | 12.5% | 12.9% |
| Median | 10.3% | 13.0% |
| Interquartile 25% (IQ1) | 8.4% | 11.3% |
| Interquartile 75% (IQ3) | 13.0% | 14.4% |
| Interquartile Range (IQR) | 4.6% | 3.1% |
| Standard Deviation (Sample) | 8.3% | 5.3% |
| Standard Deviation (Population) | 8.3% | 5.2% |
Similar Demographics by Single Male Poverty
Demographics Similar to Koreans by Single Male Poverty
In terms of single male poverty, the demographic groups most similar to Koreans are Chinese (11.0%, a difference of 0.050%), Immigrants from South Central Asia (10.9%, a difference of 0.62%), Immigrants from Afghanistan (10.9%, a difference of 0.74%), Bhutanese (11.1%, a difference of 0.75%), and Immigrants from Philippines (10.9%, a difference of 0.82%).
| Demographics | Rating | Rank | Single Male Poverty |
| Thais | 100.0 /100 | #8 | Exceptional 10.8% |
| Taiwanese | 100.0 /100 | #9 | Exceptional 10.9% |
| Immigrants | Fiji | 100.0 /100 | #10 | Exceptional 10.9% |
| Immigrants | Philippines | 100.0 /100 | #11 | Exceptional 10.9% |
| Immigrants | Afghanistan | 100.0 /100 | #12 | Exceptional 10.9% |
| Immigrants | South Central Asia | 100.0 /100 | #13 | Exceptional 10.9% |
| Chinese | 100.0 /100 | #14 | Exceptional 11.0% |
| Koreans | 100.0 /100 | #15 | Exceptional 11.0% |
| Bhutanese | 100.0 /100 | #16 | Exceptional 11.1% |
| Tsimshian | 100.0 /100 | #17 | Exceptional 11.1% |
| Immigrants | Bolivia | 100.0 /100 | #18 | Exceptional 11.1% |
| Immigrants | Moldova | 100.0 /100 | #19 | Exceptional 11.2% |
| Ethiopians | 100.0 /100 | #20 | Exceptional 11.2% |
| Asians | 100.0 /100 | #21 | Exceptional 11.2% |
| Immigrants | Pakistan | 100.0 /100 | #22 | Exceptional 11.2% |
Demographics Similar to Trinidadians and Tobagonians by Single Male Poverty
In terms of single male poverty, the demographic groups most similar to Trinidadians and Tobagonians are Slovene (13.0%, a difference of 0.010%), Immigrants from Norway (13.0%, a difference of 0.030%), Lithuanian (13.0%, a difference of 0.050%), Basque (13.0%, a difference of 0.060%), and Immigrants from Bangladesh (13.0%, a difference of 0.090%).
| Demographics | Rating | Rank | Single Male Poverty |
| Liberians | 25.2 /100 | #194 | Fair 13.0% |
| Immigrants | England | 23.4 /100 | #195 | Fair 13.0% |
| Immigrants | Grenada | 23.1 /100 | #196 | Fair 13.0% |
| Immigrants | Laos | 23.1 /100 | #197 | Fair 13.0% |
| Lithuanians | 22.1 /100 | #198 | Fair 13.0% |
| Immigrants | Norway | 21.8 /100 | #199 | Fair 13.0% |
| Slovenes | 21.6 /100 | #200 | Fair 13.0% |
| Trinidadians and Tobagonians | 21.4 /100 | #201 | Fair 13.0% |
| Basques | 20.7 /100 | #202 | Fair 13.0% |
| Immigrants | Bangladesh | 20.4 /100 | #203 | Fair 13.0% |
| Estonians | 20.3 /100 | #204 | Fair 13.0% |
| Poles | 19.3 /100 | #205 | Poor 13.0% |
| Northern Europeans | 18.9 /100 | #206 | Poor 13.0% |
| Sudanese | 17.7 /100 | #207 | Poor 13.1% |
| Immigrants | Western Africa | 17.6 /100 | #208 | Poor 13.1% |