Korean vs Trinidadian and Tobagonian Female Unemployment
COMPARE
Korean
Trinidadian and Tobagonian
Female Unemployment
Female Unemployment Comparison
Koreans
Trinidadians and Tobagonians
5.4%
FEMALE UNEMPLOYMENT
13.4/ 100
METRIC RATING
209th/ 347
METRIC RANK
6.1%
FEMALE UNEMPLOYMENT
0.0/ 100
METRIC RATING
289th/ 347
METRIC RANK
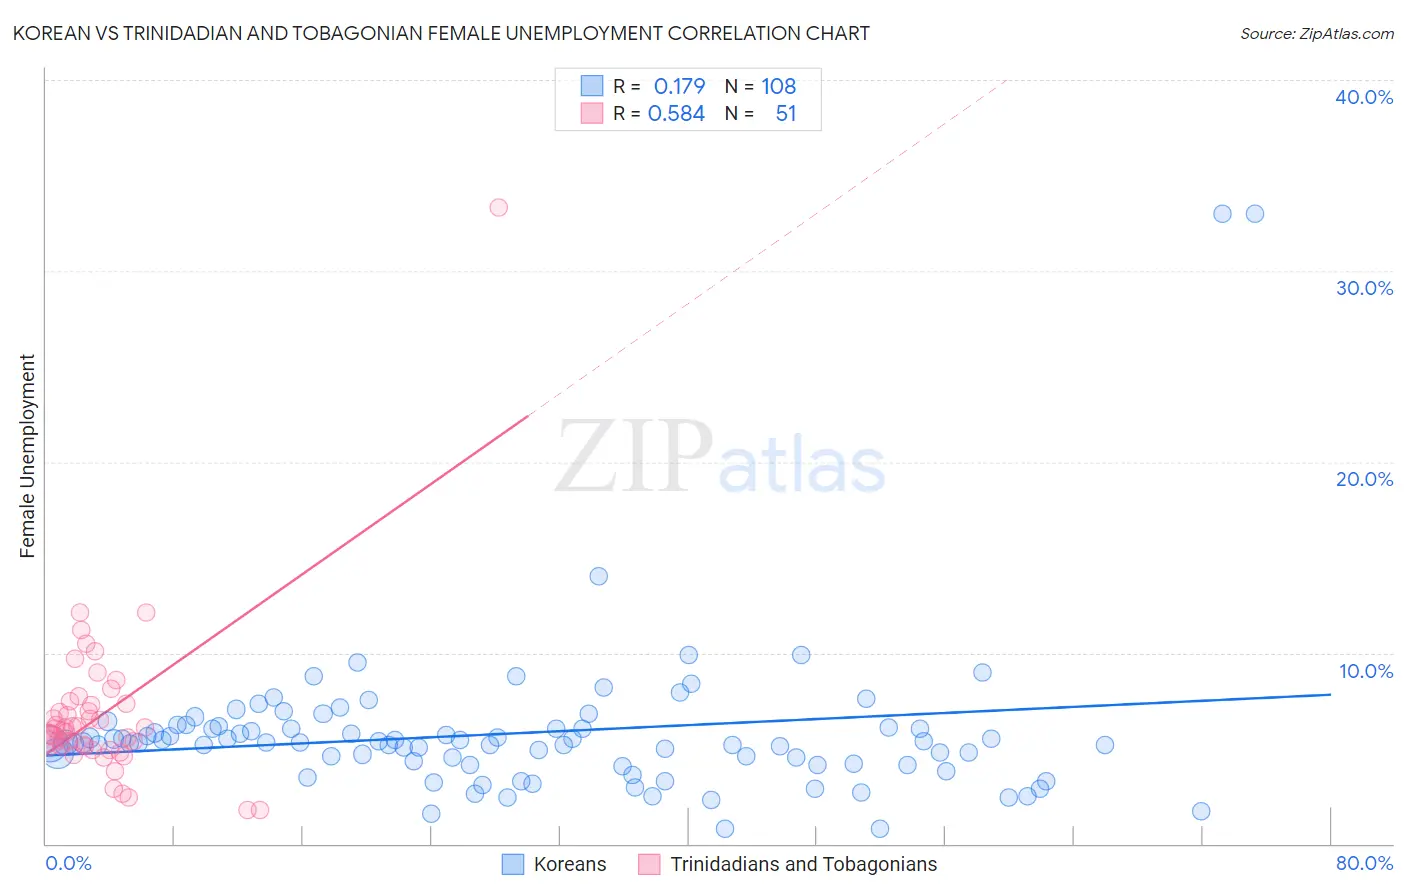
Korean vs Trinidadian and Tobagonian Female Unemployment Correlation Chart
The statistical analysis conducted on geographies consisting of 506,042,019 people shows a poor positive correlation between the proportion of Koreans and unemploymnet rate among females in the United States with a correlation coefficient (R) of 0.179 and weighted average of 5.4%. Similarly, the statistical analysis conducted on geographies consisting of 219,519,508 people shows a substantial positive correlation between the proportion of Trinidadians and Tobagonians and unemploymnet rate among females in the United States with a correlation coefficient (R) of 0.584 and weighted average of 6.1%, a difference of 12.7%.
Female Unemployment Correlation Summary
| Measurement | Korean | Trinidadian and Tobagonian |
| Minimum | 0.80% | 1.8% |
| Maximum | 33.0% | 33.3% |
| Range | 32.2% | 31.5% |
| Mean | 5.8% | 6.8% |
| Median | 5.3% | 6.0% |
| Interquartile 25% (IQ1) | 4.2% | 5.1% |
| Interquartile 75% (IQ3) | 6.1% | 7.3% |
| Interquartile Range (IQR) | 1.9% | 2.2% |
| Standard Deviation (Sample) | 4.3% | 4.4% |
| Standard Deviation (Population) | 4.2% | 4.4% |
Similar Demographics by Female Unemployment
Demographics Similar to Koreans by Female Unemployment
In terms of female unemployment, the demographic groups most similar to Koreans are Immigrants from Costa Rica (5.4%, a difference of 0.040%), Choctaw (5.4%, a difference of 0.15%), Creek (5.4%, a difference of 0.24%), Ottawa (5.4%, a difference of 0.24%), and Uruguayan (5.4%, a difference of 0.26%).
| Demographics | Rating | Rank | Female Unemployment |
| Iroquois | 20.8 /100 | #202 | Fair 5.4% |
| Immigrants | South Eastern Asia | 20.3 /100 | #203 | Fair 5.4% |
| Immigrants | Israel | 19.7 /100 | #204 | Poor 5.4% |
| Immigrants | Afghanistan | 18.9 /100 | #205 | Poor 5.4% |
| Immigrants | Brazil | 18.8 /100 | #206 | Poor 5.4% |
| Creek | 15.4 /100 | #207 | Poor 5.4% |
| Immigrants | Costa Rica | 13.7 /100 | #208 | Poor 5.4% |
| Koreans | 13.4 /100 | #209 | Poor 5.4% |
| Choctaw | 12.3 /100 | #210 | Poor 5.4% |
| Ottawa | 11.6 /100 | #211 | Poor 5.4% |
| Uruguayans | 11.4 /100 | #212 | Poor 5.4% |
| Samoans | 10.6 /100 | #213 | Poor 5.4% |
| Seminole | 10.3 /100 | #214 | Poor 5.4% |
| Immigrants | Nicaragua | 10.2 /100 | #215 | Poor 5.4% |
| Comanche | 10.0 /100 | #216 | Poor 5.4% |
Demographics Similar to Trinidadians and Tobagonians by Female Unemployment
In terms of female unemployment, the demographic groups most similar to Trinidadians and Tobagonians are Haitian (6.1%, a difference of 0.010%), Immigrants from Guatemala (6.1%, a difference of 0.050%), Immigrants from Caribbean (6.1%, a difference of 0.060%), Chippewa (6.1%, a difference of 0.080%), and Immigrants from Cabo Verde (6.1%, a difference of 0.11%).
| Demographics | Rating | Rank | Female Unemployment |
| Colville | 0.0 /100 | #282 | Tragic 6.0% |
| Salvadorans | 0.0 /100 | #283 | Tragic 6.0% |
| Immigrants | Senegal | 0.0 /100 | #284 | Tragic 6.1% |
| Immigrants | Cabo Verde | 0.0 /100 | #285 | Tragic 6.1% |
| Chippewa | 0.0 /100 | #286 | Tragic 6.1% |
| Immigrants | Guatemala | 0.0 /100 | #287 | Tragic 6.1% |
| Haitians | 0.0 /100 | #288 | Tragic 6.1% |
| Trinidadians and Tobagonians | 0.0 /100 | #289 | Tragic 6.1% |
| Immigrants | Caribbean | 0.0 /100 | #290 | Tragic 6.1% |
| Immigrants | West Indies | 0.0 /100 | #291 | Tragic 6.1% |
| Immigrants | Trinidad and Tobago | 0.0 /100 | #292 | Tragic 6.1% |
| Mexicans | 0.0 /100 | #293 | Tragic 6.1% |
| Immigrants | El Salvador | 0.0 /100 | #294 | Tragic 6.1% |
| Immigrants | Latin America | 0.0 /100 | #295 | Tragic 6.1% |
| Alaskan Athabascans | 0.0 /100 | #296 | Tragic 6.1% |