Korean vs Trinidadian and Tobagonian 2nd Grade
COMPARE
Korean
Trinidadian and Tobagonian
2nd Grade
2nd Grade Comparison
Koreans
Trinidadians and Tobagonians
97.5%
2ND GRADE
1.5/ 100
METRIC RATING
240th/ 347
METRIC RANK
97.3%
2ND GRADE
0.1/ 100
METRIC RATING
281st/ 347
METRIC RANK
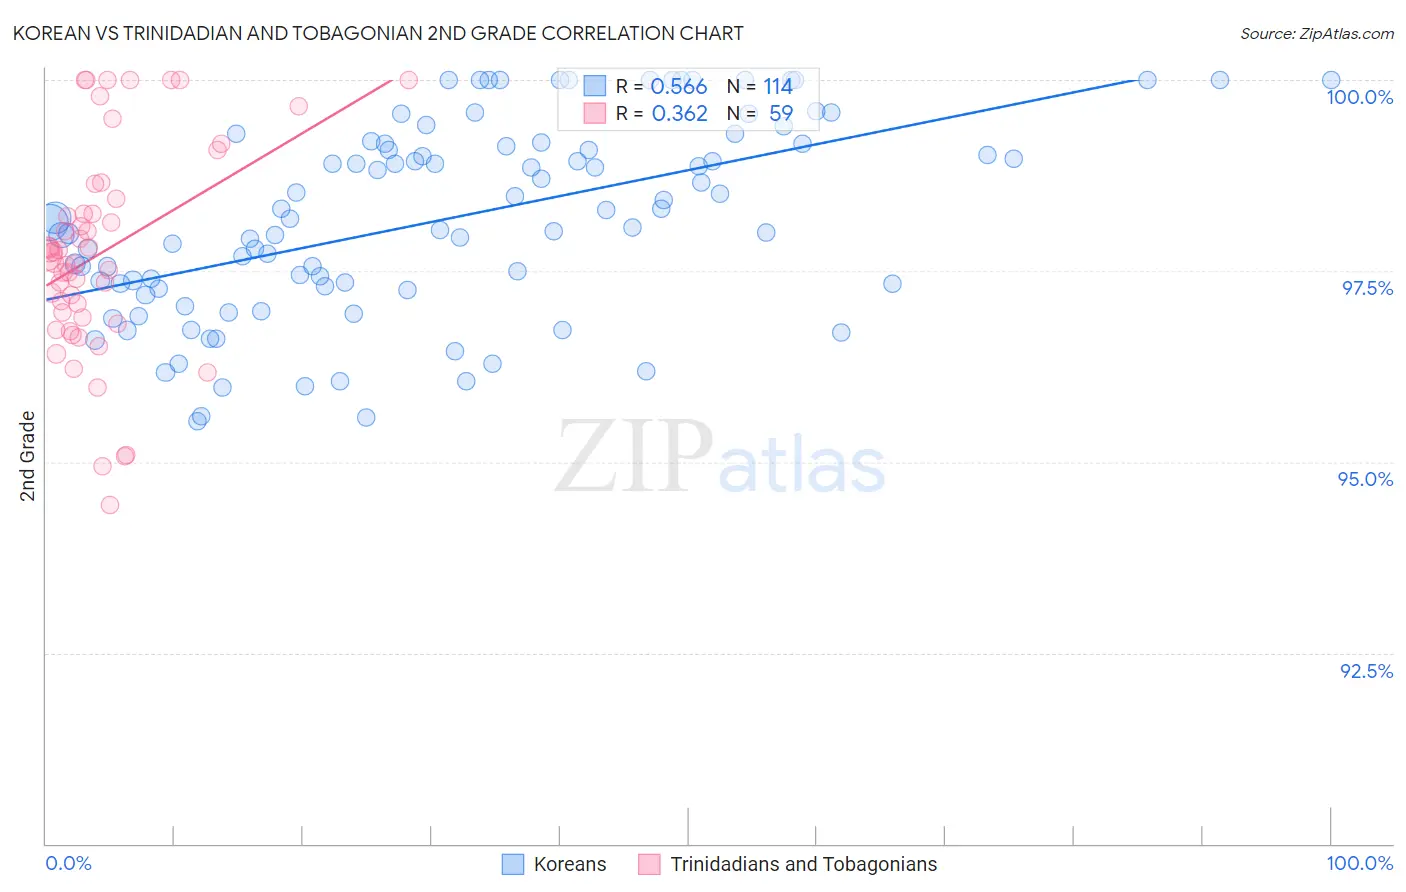
Korean vs Trinidadian and Tobagonian 2nd Grade Correlation Chart
The statistical analysis conducted on geographies consisting of 510,935,951 people shows a substantial positive correlation between the proportion of Koreans and percentage of population with at least 2nd grade education in the United States with a correlation coefficient (R) of 0.566 and weighted average of 97.5%. Similarly, the statistical analysis conducted on geographies consisting of 219,882,819 people shows a mild positive correlation between the proportion of Trinidadians and Tobagonians and percentage of population with at least 2nd grade education in the United States with a correlation coefficient (R) of 0.362 and weighted average of 97.3%, a difference of 0.26%.
2nd Grade Correlation Summary
| Measurement | Korean | Trinidadian and Tobagonian |
| Minimum | 95.5% | 94.4% |
| Maximum | 100.0% | 100.0% |
| Range | 4.5% | 5.6% |
| Mean | 98.2% | 97.7% |
| Median | 98.2% | 97.7% |
| Interquartile 25% (IQ1) | 97.3% | 96.9% |
| Interquartile 75% (IQ3) | 99.2% | 98.4% |
| Interquartile Range (IQR) | 1.9% | 1.6% |
| Standard Deviation (Sample) | 1.3% | 1.4% |
| Standard Deviation (Population) | 1.2% | 1.3% |
Similar Demographics by 2nd Grade
Demographics Similar to Koreans by 2nd Grade
In terms of 2nd grade, the demographic groups most similar to Koreans are Nigerian (97.6%, a difference of 0.010%), U.S. Virgin Islander (97.6%, a difference of 0.010%), Immigrants from Eastern Asia (97.6%, a difference of 0.010%), Liberian (97.6%, a difference of 0.010%), and Ethiopian (97.5%, a difference of 0.010%).
| Demographics | Rating | Rank | 2nd Grade |
| Immigrants | Uruguay | 2.1 /100 | #233 | Tragic 97.6% |
| Immigrants | Malaysia | 2.0 /100 | #234 | Tragic 97.6% |
| Colombians | 1.9 /100 | #235 | Tragic 97.6% |
| Nigerians | 1.7 /100 | #236 | Tragic 97.6% |
| U.S. Virgin Islanders | 1.6 /100 | #237 | Tragic 97.6% |
| Immigrants | Eastern Asia | 1.6 /100 | #238 | Tragic 97.6% |
| Liberians | 1.6 /100 | #239 | Tragic 97.6% |
| Koreans | 1.5 /100 | #240 | Tragic 97.5% |
| Ethiopians | 1.2 /100 | #241 | Tragic 97.5% |
| Immigrants | Indonesia | 1.2 /100 | #242 | Tragic 97.5% |
| Asians | 1.1 /100 | #243 | Tragic 97.5% |
| Immigrants | Iraq | 1.0 /100 | #244 | Tragic 97.5% |
| Immigrants | Eastern Africa | 0.9 /100 | #245 | Tragic 97.5% |
| South Americans | 0.9 /100 | #246 | Tragic 97.5% |
| Immigrants | Senegal | 0.9 /100 | #247 | Tragic 97.5% |
Demographics Similar to Trinidadians and Tobagonians by 2nd Grade
In terms of 2nd grade, the demographic groups most similar to Trinidadians and Tobagonians are Afghan (97.3%, a difference of 0.0%), Immigrants from Ghana (97.3%, a difference of 0.010%), Barbadian (97.3%, a difference of 0.010%), Immigrants from Uzbekistan (97.3%, a difference of 0.020%), and Immigrants from Philippines (97.3%, a difference of 0.030%).
| Demographics | Rating | Rank | 2nd Grade |
| Ghanaians | 0.1 /100 | #274 | Tragic 97.4% |
| Immigrants | China | 0.1 /100 | #275 | Tragic 97.3% |
| Immigrants | Philippines | 0.1 /100 | #276 | Tragic 97.3% |
| Immigrants | Western Africa | 0.1 /100 | #277 | Tragic 97.3% |
| Immigrants | Uzbekistan | 0.1 /100 | #278 | Tragic 97.3% |
| Immigrants | Ghana | 0.1 /100 | #279 | Tragic 97.3% |
| Afghans | 0.1 /100 | #280 | Tragic 97.3% |
| Trinidadians and Tobagonians | 0.1 /100 | #281 | Tragic 97.3% |
| Barbadians | 0.1 /100 | #282 | Tragic 97.3% |
| Immigrants | Trinidad and Tobago | 0.0 /100 | #283 | Tragic 97.2% |
| Immigrants | West Indies | 0.0 /100 | #284 | Tragic 97.2% |
| Immigrants | Hong Kong | 0.0 /100 | #285 | Tragic 97.2% |
| Immigrants | Barbados | 0.0 /100 | #286 | Tragic 97.2% |
| Immigrants | Portugal | 0.0 /100 | #287 | Tragic 97.2% |
| Immigrants | Thailand | 0.0 /100 | #288 | Tragic 97.2% |