Korean vs Dutch West Indian Single Male Poverty
COMPARE
Korean
Dutch West Indian
Single Male Poverty
Single Male Poverty Comparison
Koreans
Dutch West Indians
11.0%
SINGLE MALE POVERTY
100.0/ 100
METRIC RATING
15th/ 347
METRIC RANK
16.1%
SINGLE MALE POVERTY
0.0/ 100
METRIC RATING
316th/ 347
METRIC RANK
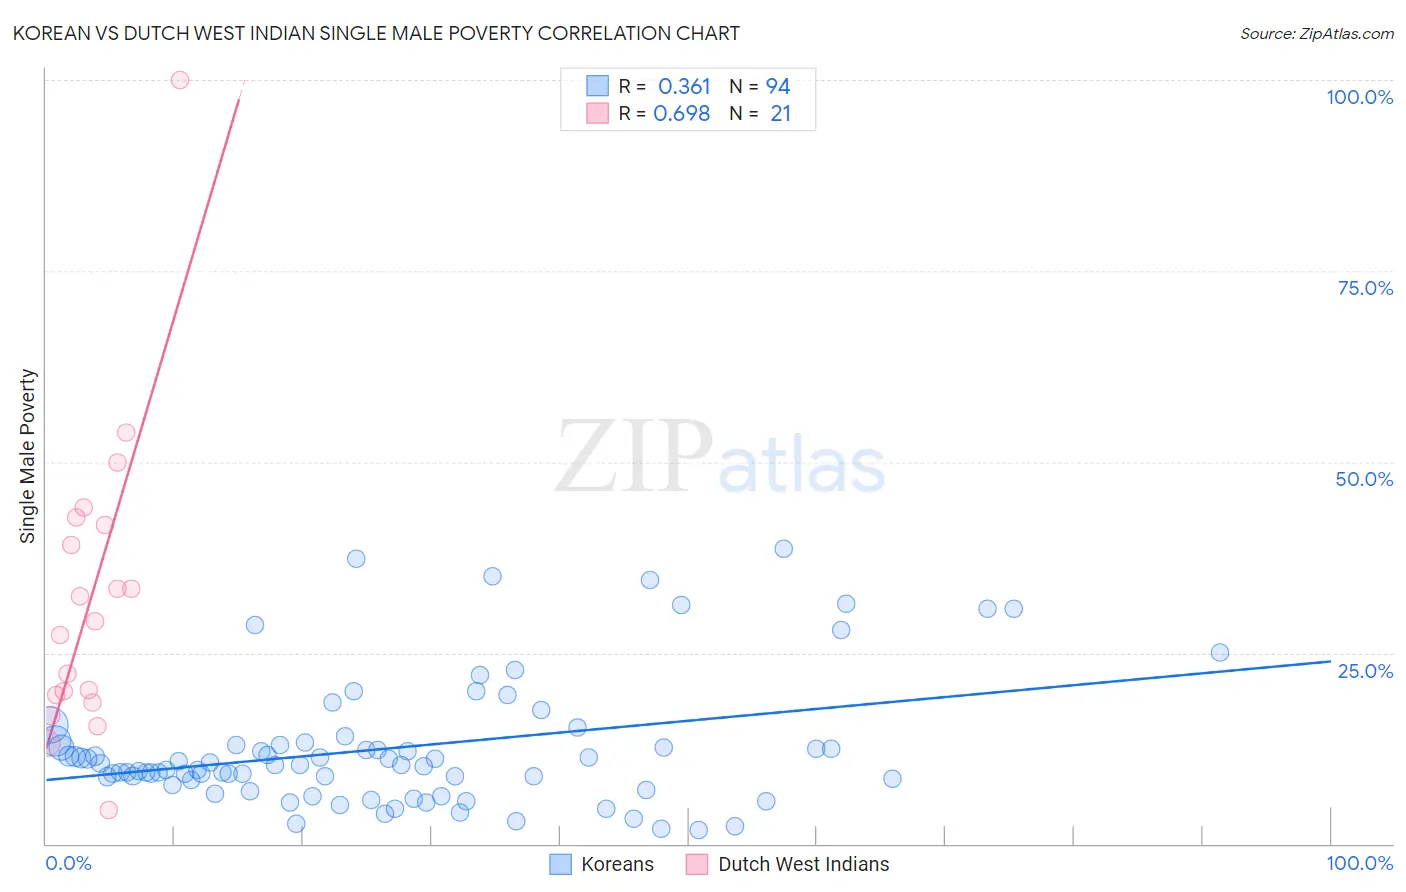
Korean vs Dutch West Indian Single Male Poverty Correlation Chart
The statistical analysis conducted on geographies consisting of 437,940,785 people shows a mild positive correlation between the proportion of Koreans and poverty level among single males in the United States with a correlation coefficient (R) of 0.361 and weighted average of 11.0%. Similarly, the statistical analysis conducted on geographies consisting of 82,367,867 people shows a significant positive correlation between the proportion of Dutch West Indians and poverty level among single males in the United States with a correlation coefficient (R) of 0.698 and weighted average of 16.1%, a difference of 46.8%.
Single Male Poverty Correlation Summary
| Measurement | Korean | Dutch West Indian |
| Minimum | 1.9% | 4.5% |
| Maximum | 38.6% | 100.0% |
| Range | 36.8% | 95.5% |
| Mean | 12.5% | 32.3% |
| Median | 10.3% | 29.1% |
| Interquartile 25% (IQ1) | 8.4% | 19.0% |
| Interquartile 75% (IQ3) | 13.0% | 42.3% |
| Interquartile Range (IQR) | 4.6% | 23.3% |
| Standard Deviation (Sample) | 8.3% | 20.2% |
| Standard Deviation (Population) | 8.3% | 19.8% |
Similar Demographics by Single Male Poverty
Demographics Similar to Koreans by Single Male Poverty
In terms of single male poverty, the demographic groups most similar to Koreans are Chinese (11.0%, a difference of 0.050%), Immigrants from South Central Asia (10.9%, a difference of 0.62%), Immigrants from Afghanistan (10.9%, a difference of 0.74%), Bhutanese (11.1%, a difference of 0.75%), and Immigrants from Philippines (10.9%, a difference of 0.82%).
| Demographics | Rating | Rank | Single Male Poverty |
| Thais | 100.0 /100 | #8 | Exceptional 10.8% |
| Taiwanese | 100.0 /100 | #9 | Exceptional 10.9% |
| Immigrants | Fiji | 100.0 /100 | #10 | Exceptional 10.9% |
| Immigrants | Philippines | 100.0 /100 | #11 | Exceptional 10.9% |
| Immigrants | Afghanistan | 100.0 /100 | #12 | Exceptional 10.9% |
| Immigrants | South Central Asia | 100.0 /100 | #13 | Exceptional 10.9% |
| Chinese | 100.0 /100 | #14 | Exceptional 11.0% |
| Koreans | 100.0 /100 | #15 | Exceptional 11.0% |
| Bhutanese | 100.0 /100 | #16 | Exceptional 11.1% |
| Tsimshian | 100.0 /100 | #17 | Exceptional 11.1% |
| Immigrants | Bolivia | 100.0 /100 | #18 | Exceptional 11.1% |
| Immigrants | Moldova | 100.0 /100 | #19 | Exceptional 11.2% |
| Ethiopians | 100.0 /100 | #20 | Exceptional 11.2% |
| Asians | 100.0 /100 | #21 | Exceptional 11.2% |
| Immigrants | Pakistan | 100.0 /100 | #22 | Exceptional 11.2% |
Demographics Similar to Dutch West Indians by Single Male Poverty
In terms of single male poverty, the demographic groups most similar to Dutch West Indians are Cheyenne (16.1%, a difference of 0.14%), Alaskan Athabascan (16.1%, a difference of 0.19%), Black/African American (16.2%, a difference of 0.34%), Cherokee (16.1%, a difference of 0.48%), and Seminole (16.0%, a difference of 0.71%).
| Demographics | Rating | Rank | Single Male Poverty |
| Americans | 0.0 /100 | #309 | Tragic 15.8% |
| Yakama | 0.0 /100 | #310 | Tragic 15.9% |
| Seminole | 0.0 /100 | #311 | Tragic 16.0% |
| Comanche | 0.0 /100 | #312 | Tragic 16.0% |
| Cherokee | 0.0 /100 | #313 | Tragic 16.1% |
| Alaskan Athabascans | 0.0 /100 | #314 | Tragic 16.1% |
| Cheyenne | 0.0 /100 | #315 | Tragic 16.1% |
| Dutch West Indians | 0.0 /100 | #316 | Tragic 16.1% |
| Blacks/African Americans | 0.0 /100 | #317 | Tragic 16.2% |
| Chickasaw | 0.0 /100 | #318 | Tragic 16.3% |
| Chippewa | 0.0 /100 | #319 | Tragic 16.4% |
| Marshallese | 0.0 /100 | #320 | Tragic 16.4% |
| Osage | 0.0 /100 | #321 | Tragic 16.5% |
| Shoshone | 0.0 /100 | #322 | Tragic 16.7% |
| Creek | 0.0 /100 | #323 | Tragic 16.8% |