Immigrants from Micronesia vs Trinidadian and Tobagonian Single Male Poverty
COMPARE
Immigrants from Micronesia
Trinidadian and Tobagonian
Single Male Poverty
Single Male Poverty Comparison
Immigrants from Micronesia
Trinidadians and Tobagonians
13.5%
SINGLE MALE POVERTY
1.2/ 100
METRIC RATING
246th/ 347
METRIC RANK
13.0%
SINGLE MALE POVERTY
21.4/ 100
METRIC RATING
201st/ 347
METRIC RANK
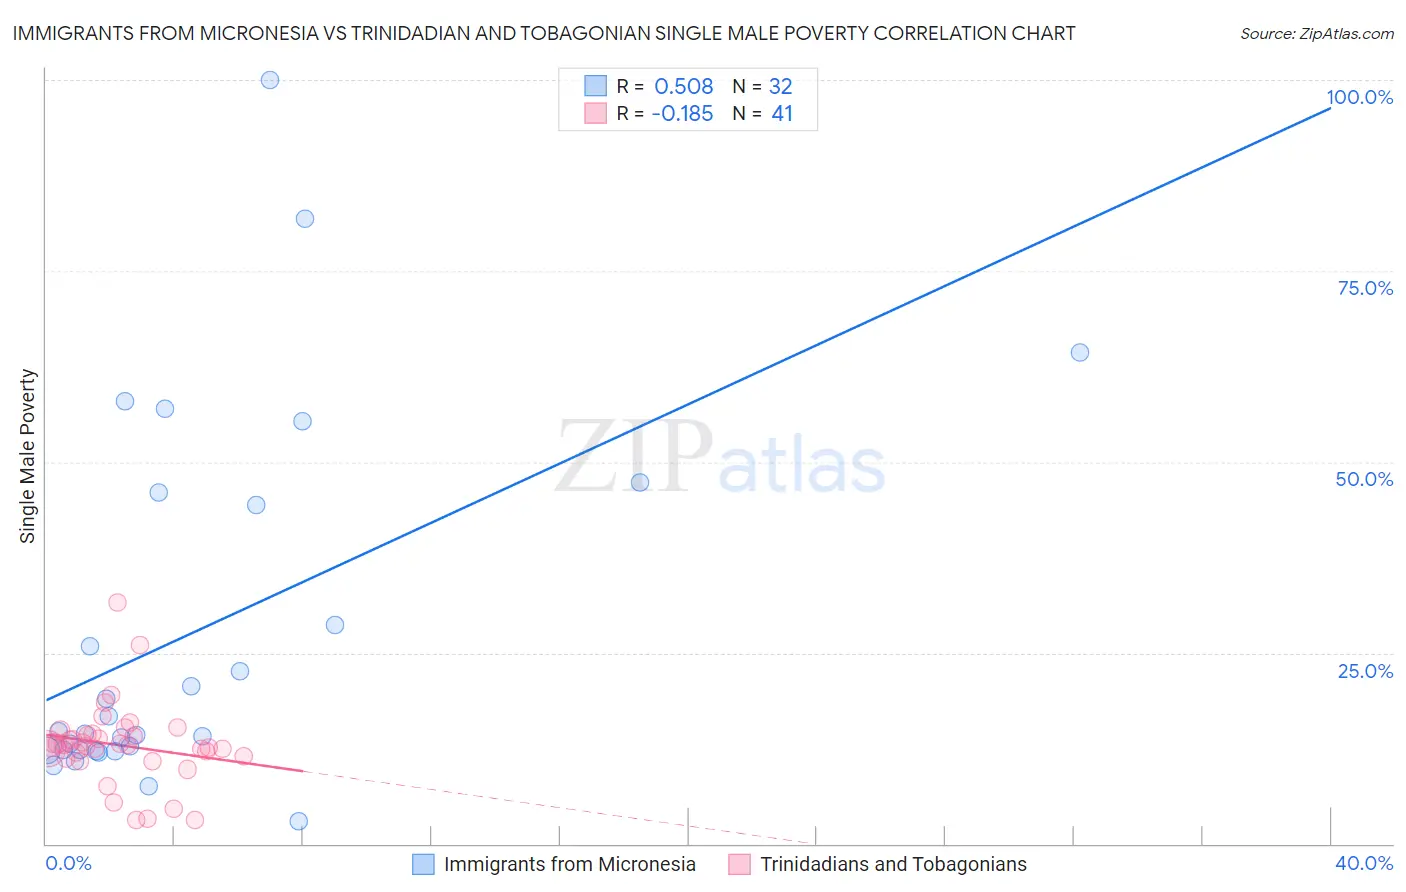
Immigrants from Micronesia vs Trinidadian and Tobagonian Single Male Poverty Correlation Chart
The statistical analysis conducted on geographies consisting of 60,290,539 people shows a substantial positive correlation between the proportion of Immigrants from Micronesia and poverty level among single males in the United States with a correlation coefficient (R) of 0.508 and weighted average of 13.5%. Similarly, the statistical analysis conducted on geographies consisting of 204,213,293 people shows a poor negative correlation between the proportion of Trinidadians and Tobagonians and poverty level among single males in the United States with a correlation coefficient (R) of -0.185 and weighted average of 13.0%, a difference of 4.0%.
Single Male Poverty Correlation Summary
| Measurement | Immigrants from Micronesia | Trinidadian and Tobagonian |
| Minimum | 3.0% | 3.0% |
| Maximum | 100.0% | 31.6% |
| Range | 97.0% | 28.6% |
| Mean | 27.8% | 12.9% |
| Median | 14.5% | 13.0% |
| Interquartile 25% (IQ1) | 12.2% | 11.3% |
| Interquartile 75% (IQ3) | 45.2% | 14.4% |
| Interquartile Range (IQR) | 32.9% | 3.1% |
| Standard Deviation (Sample) | 23.9% | 5.3% |
| Standard Deviation (Population) | 23.5% | 5.2% |
Similar Demographics by Single Male Poverty
Demographics Similar to Immigrants from Micronesia by Single Male Poverty
In terms of single male poverty, the demographic groups most similar to Immigrants from Micronesia are Belgian (13.5%, a difference of 0.010%), Czech (13.5%, a difference of 0.040%), Immigrants from Latin America (13.5%, a difference of 0.10%), Spanish (13.6%, a difference of 0.28%), and Immigrants from Somalia (13.6%, a difference of 0.30%).
| Demographics | Rating | Rank | Single Male Poverty |
| Czechoslovakians | 3.0 /100 | #239 | Tragic 13.4% |
| Belizeans | 2.3 /100 | #240 | Tragic 13.4% |
| Immigrants | Germany | 2.1 /100 | #241 | Tragic 13.4% |
| Carpatho Rusyns | 2.1 /100 | #242 | Tragic 13.4% |
| Barbadians | 2.1 /100 | #243 | Tragic 13.4% |
| Immigrants | Senegal | 1.7 /100 | #244 | Tragic 13.5% |
| Immigrants | Latin America | 1.3 /100 | #245 | Tragic 13.5% |
| Immigrants | Micronesia | 1.2 /100 | #246 | Tragic 13.5% |
| Belgians | 1.2 /100 | #247 | Tragic 13.5% |
| Czechs | 1.2 /100 | #248 | Tragic 13.5% |
| Spanish | 1.0 /100 | #249 | Tragic 13.6% |
| Immigrants | Somalia | 1.0 /100 | #250 | Tragic 13.6% |
| Immigrants | Zaire | 0.9 /100 | #251 | Tragic 13.6% |
| Finns | 0.9 /100 | #252 | Tragic 13.6% |
| German Russians | 0.8 /100 | #253 | Tragic 13.6% |
Demographics Similar to Trinidadians and Tobagonians by Single Male Poverty
In terms of single male poverty, the demographic groups most similar to Trinidadians and Tobagonians are Slovene (13.0%, a difference of 0.010%), Immigrants from Norway (13.0%, a difference of 0.030%), Lithuanian (13.0%, a difference of 0.050%), Basque (13.0%, a difference of 0.060%), and Immigrants from Bangladesh (13.0%, a difference of 0.090%).
| Demographics | Rating | Rank | Single Male Poverty |
| Liberians | 25.2 /100 | #194 | Fair 13.0% |
| Immigrants | England | 23.4 /100 | #195 | Fair 13.0% |
| Immigrants | Grenada | 23.1 /100 | #196 | Fair 13.0% |
| Immigrants | Laos | 23.1 /100 | #197 | Fair 13.0% |
| Lithuanians | 22.1 /100 | #198 | Fair 13.0% |
| Immigrants | Norway | 21.8 /100 | #199 | Fair 13.0% |
| Slovenes | 21.6 /100 | #200 | Fair 13.0% |
| Trinidadians and Tobagonians | 21.4 /100 | #201 | Fair 13.0% |
| Basques | 20.7 /100 | #202 | Fair 13.0% |
| Immigrants | Bangladesh | 20.4 /100 | #203 | Fair 13.0% |
| Estonians | 20.3 /100 | #204 | Fair 13.0% |
| Poles | 19.3 /100 | #205 | Poor 13.0% |
| Northern Europeans | 18.9 /100 | #206 | Poor 13.0% |
| Sudanese | 17.7 /100 | #207 | Poor 13.1% |
| Immigrants | Western Africa | 17.6 /100 | #208 | Poor 13.1% |