Immigrants from Poland vs Trinidadian and Tobagonian Single Male Poverty
COMPARE
Immigrants from Poland
Trinidadian and Tobagonian
Single Male Poverty
Single Male Poverty Comparison
Immigrants from Poland
Trinidadians and Tobagonians
11.5%
SINGLE MALE POVERTY
99.9/ 100
METRIC RATING
45th/ 347
METRIC RANK
13.0%
SINGLE MALE POVERTY
21.4/ 100
METRIC RATING
201st/ 347
METRIC RANK
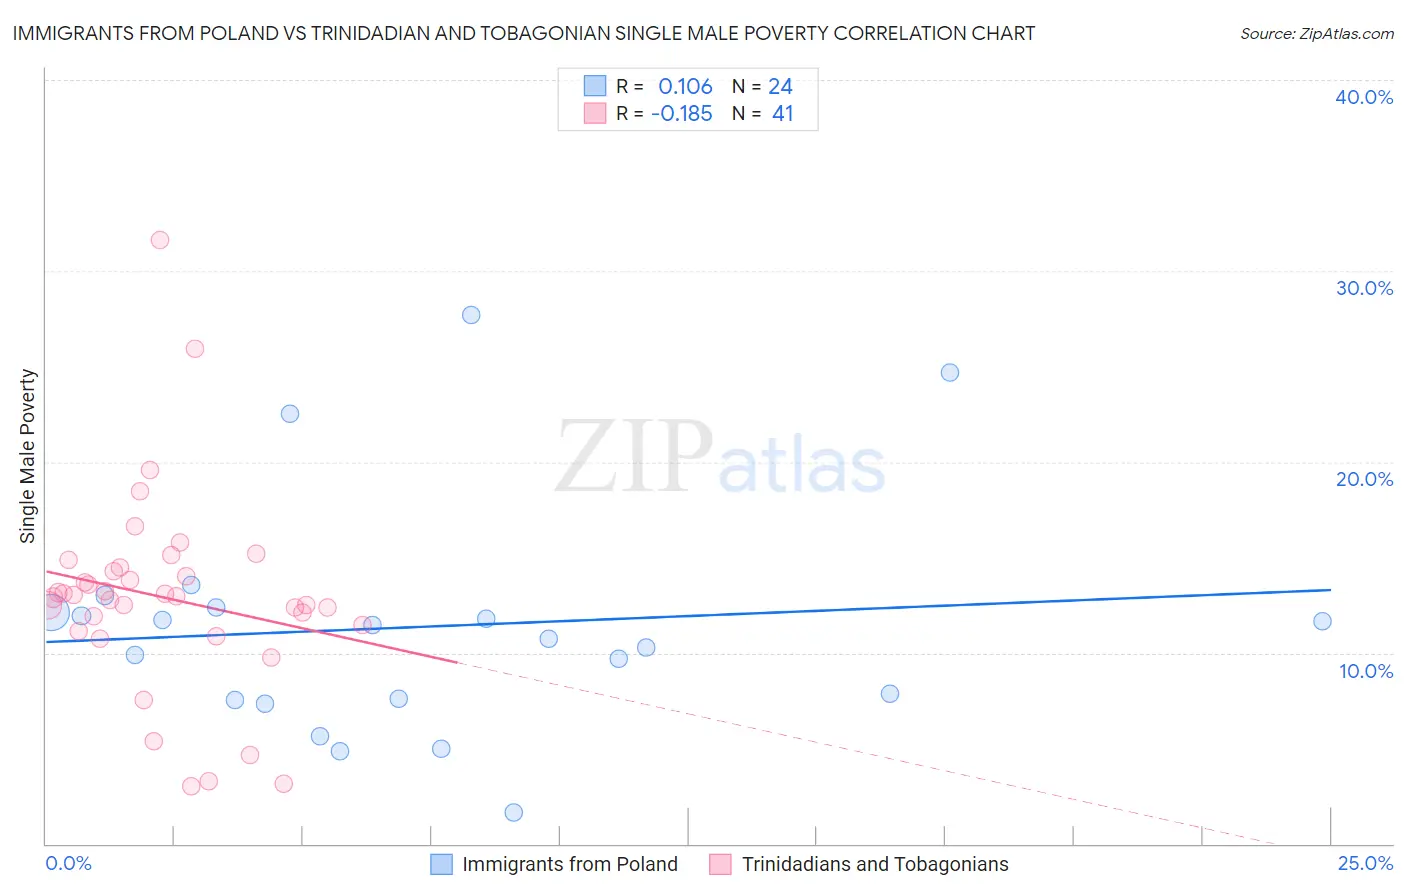
Immigrants from Poland vs Trinidadian and Tobagonian Single Male Poverty Correlation Chart
The statistical analysis conducted on geographies consisting of 269,525,262 people shows a poor positive correlation between the proportion of Immigrants from Poland and poverty level among single males in the United States with a correlation coefficient (R) of 0.106 and weighted average of 11.5%. Similarly, the statistical analysis conducted on geographies consisting of 204,213,293 people shows a poor negative correlation between the proportion of Trinidadians and Tobagonians and poverty level among single males in the United States with a correlation coefficient (R) of -0.185 and weighted average of 13.0%, a difference of 12.7%.
Single Male Poverty Correlation Summary
| Measurement | Immigrants from Poland | Trinidadian and Tobagonian |
| Minimum | 1.6% | 3.0% |
| Maximum | 27.7% | 31.6% |
| Range | 26.1% | 28.6% |
| Mean | 11.4% | 12.9% |
| Median | 11.1% | 13.0% |
| Interquartile 25% (IQ1) | 7.6% | 11.3% |
| Interquartile 75% (IQ3) | 12.2% | 14.4% |
| Interquartile Range (IQR) | 4.7% | 3.1% |
| Standard Deviation (Sample) | 6.1% | 5.3% |
| Standard Deviation (Population) | 6.0% | 5.2% |
Similar Demographics by Single Male Poverty
Demographics Similar to Immigrants from Poland by Single Male Poverty
In terms of single male poverty, the demographic groups most similar to Immigrants from Poland are Immigrants from Cameroon (11.5%, a difference of 0.020%), Immigrants from Peru (11.5%, a difference of 0.030%), Immigrants from Bulgaria (11.6%, a difference of 0.13%), Egyptian (11.5%, a difference of 0.18%), and Immigrants from Iraq (11.5%, a difference of 0.23%).
| Demographics | Rating | Rank | Single Male Poverty |
| Sri Lankans | 100.0 /100 | #38 | Exceptional 11.5% |
| Soviet Union | 100.0 /100 | #39 | Exceptional 11.5% |
| Immigrants | Korea | 100.0 /100 | #40 | Exceptional 11.5% |
| Immigrants | Iraq | 99.9 /100 | #41 | Exceptional 11.5% |
| Egyptians | 99.9 /100 | #42 | Exceptional 11.5% |
| Immigrants | Peru | 99.9 /100 | #43 | Exceptional 11.5% |
| Immigrants | Cameroon | 99.9 /100 | #44 | Exceptional 11.5% |
| Immigrants | Poland | 99.9 /100 | #45 | Exceptional 11.5% |
| Immigrants | Bulgaria | 99.9 /100 | #46 | Exceptional 11.6% |
| Nepalese | 99.9 /100 | #47 | Exceptional 11.6% |
| Immigrants | Indonesia | 99.9 /100 | #48 | Exceptional 11.6% |
| Tlingit-Haida | 99.9 /100 | #49 | Exceptional 11.6% |
| Immigrants | Lithuania | 99.9 /100 | #50 | Exceptional 11.6% |
| Paraguayans | 99.9 /100 | #51 | Exceptional 11.6% |
| Samoans | 99.9 /100 | #52 | Exceptional 11.7% |
Demographics Similar to Trinidadians and Tobagonians by Single Male Poverty
In terms of single male poverty, the demographic groups most similar to Trinidadians and Tobagonians are Slovene (13.0%, a difference of 0.010%), Immigrants from Norway (13.0%, a difference of 0.030%), Lithuanian (13.0%, a difference of 0.050%), Basque (13.0%, a difference of 0.060%), and Immigrants from Bangladesh (13.0%, a difference of 0.090%).
| Demographics | Rating | Rank | Single Male Poverty |
| Liberians | 25.2 /100 | #194 | Fair 13.0% |
| Immigrants | England | 23.4 /100 | #195 | Fair 13.0% |
| Immigrants | Grenada | 23.1 /100 | #196 | Fair 13.0% |
| Immigrants | Laos | 23.1 /100 | #197 | Fair 13.0% |
| Lithuanians | 22.1 /100 | #198 | Fair 13.0% |
| Immigrants | Norway | 21.8 /100 | #199 | Fair 13.0% |
| Slovenes | 21.6 /100 | #200 | Fair 13.0% |
| Trinidadians and Tobagonians | 21.4 /100 | #201 | Fair 13.0% |
| Basques | 20.7 /100 | #202 | Fair 13.0% |
| Immigrants | Bangladesh | 20.4 /100 | #203 | Fair 13.0% |
| Estonians | 20.3 /100 | #204 | Fair 13.0% |
| Poles | 19.3 /100 | #205 | Poor 13.0% |
| Northern Europeans | 18.9 /100 | #206 | Poor 13.0% |
| Sudanese | 17.7 /100 | #207 | Poor 13.1% |
| Immigrants | Western Africa | 17.6 /100 | #208 | Poor 13.1% |