Korean vs Immigrants from Vietnam Single Male Poverty
COMPARE
Korean
Immigrants from Vietnam
Single Male Poverty
Single Male Poverty Comparison
Koreans
Immigrants from Vietnam
11.0%
SINGLE MALE POVERTY
100.0/ 100
METRIC RATING
15th/ 347
METRIC RANK
11.4%
SINGLE MALE POVERTY
100.0/ 100
METRIC RATING
33rd/ 347
METRIC RANK
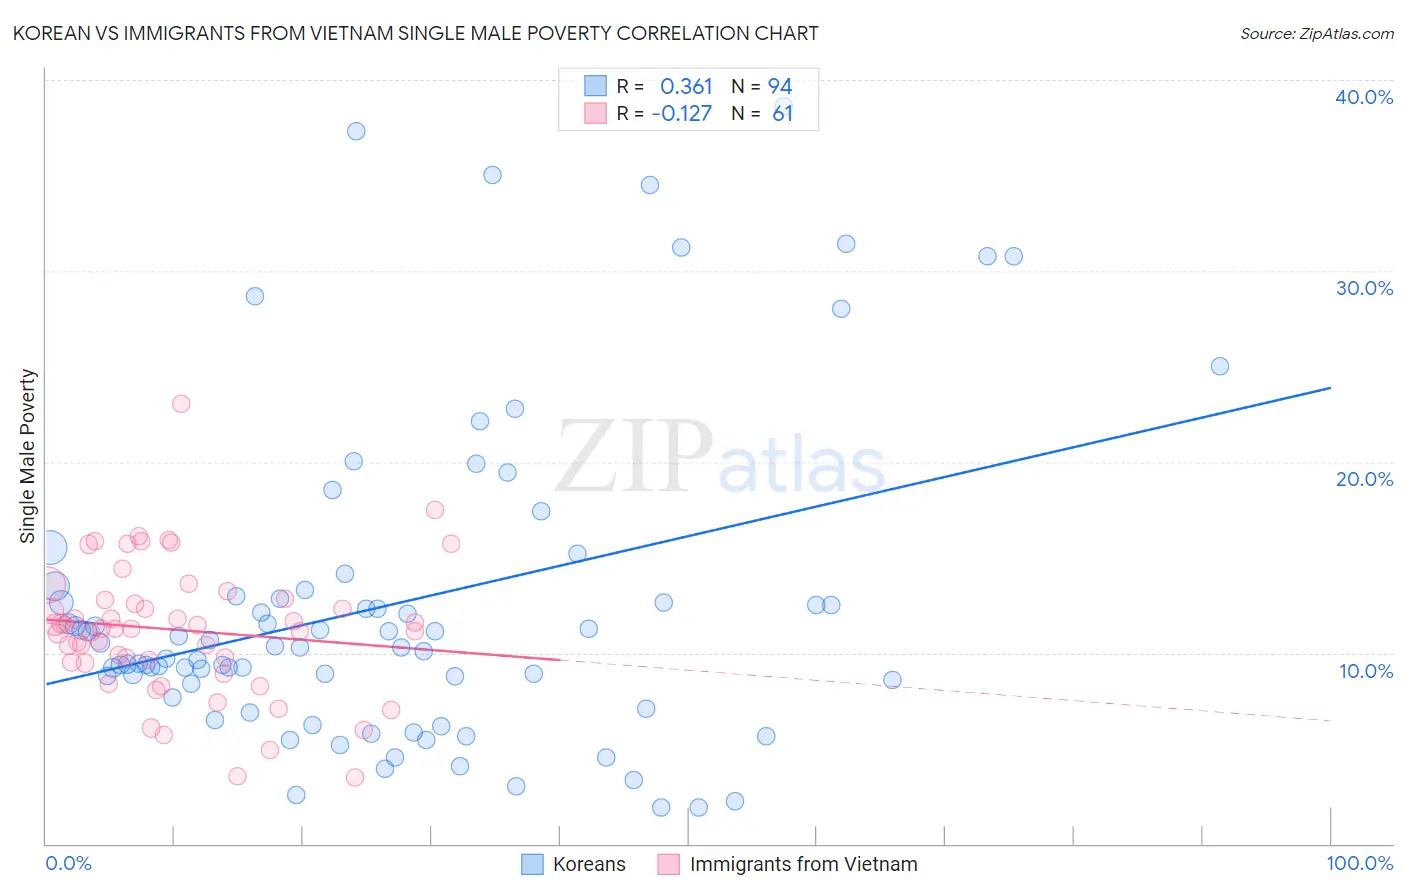
Korean vs Immigrants from Vietnam Single Male Poverty Correlation Chart
The statistical analysis conducted on geographies consisting of 437,940,785 people shows a mild positive correlation between the proportion of Koreans and poverty level among single males in the United States with a correlation coefficient (R) of 0.361 and weighted average of 11.0%. Similarly, the statistical analysis conducted on geographies consisting of 361,378,073 people shows a poor negative correlation between the proportion of Immigrants from Vietnam and poverty level among single males in the United States with a correlation coefficient (R) of -0.127 and weighted average of 11.4%, a difference of 4.0%.
Single Male Poverty Correlation Summary
| Measurement | Korean | Immigrants from Vietnam |
| Minimum | 1.9% | 3.5% |
| Maximum | 38.6% | 23.0% |
| Range | 36.8% | 19.5% |
| Mean | 12.5% | 11.2% |
| Median | 10.3% | 11.3% |
| Interquartile 25% (IQ1) | 8.4% | 9.5% |
| Interquartile 75% (IQ3) | 13.0% | 12.8% |
| Interquartile Range (IQR) | 4.6% | 3.3% |
| Standard Deviation (Sample) | 8.3% | 3.5% |
| Standard Deviation (Population) | 8.3% | 3.5% |
Demographics Similar to Koreans and Immigrants from Vietnam by Single Male Poverty
In terms of single male poverty, the demographic groups most similar to Koreans are Chinese (11.0%, a difference of 0.050%), Bhutanese (11.1%, a difference of 0.75%), Tsimshian (11.1%, a difference of 0.85%), Immigrants from Bolivia (11.1%, a difference of 1.2%), and Immigrants from Moldova (11.2%, a difference of 1.6%). Similarly, the demographic groups most similar to Immigrants from Vietnam are Immigrants from Ethiopia (11.4%, a difference of 0.040%), Immigrants from Eastern Asia (11.4%, a difference of 0.070%), Immigrants from Iran (11.4%, a difference of 0.16%), Iranian (11.4%, a difference of 0.24%), and Immigrants from Egypt (11.4%, a difference of 0.30%).
| Demographics | Rating | Rank | Single Male Poverty |
| Chinese | 100.0 /100 | #14 | Exceptional 11.0% |
| Koreans | 100.0 /100 | #15 | Exceptional 11.0% |
| Bhutanese | 100.0 /100 | #16 | Exceptional 11.1% |
| Tsimshian | 100.0 /100 | #17 | Exceptional 11.1% |
| Immigrants | Bolivia | 100.0 /100 | #18 | Exceptional 11.1% |
| Immigrants | Moldova | 100.0 /100 | #19 | Exceptional 11.2% |
| Ethiopians | 100.0 /100 | #20 | Exceptional 11.2% |
| Asians | 100.0 /100 | #21 | Exceptional 11.2% |
| Immigrants | Pakistan | 100.0 /100 | #22 | Exceptional 11.2% |
| Bolivians | 100.0 /100 | #23 | Exceptional 11.2% |
| Indians (Asian) | 100.0 /100 | #24 | Exceptional 11.3% |
| Maltese | 100.0 /100 | #25 | Exceptional 11.3% |
| Immigrants | Japan | 100.0 /100 | #26 | Exceptional 11.3% |
| Immigrants | China | 100.0 /100 | #27 | Exceptional 11.4% |
| Immigrants | Asia | 100.0 /100 | #28 | Exceptional 11.4% |
| Immigrants | Egypt | 100.0 /100 | #29 | Exceptional 11.4% |
| Iranians | 100.0 /100 | #30 | Exceptional 11.4% |
| Immigrants | Iran | 100.0 /100 | #31 | Exceptional 11.4% |
| Immigrants | Eastern Asia | 100.0 /100 | #32 | Exceptional 11.4% |
| Immigrants | Vietnam | 100.0 /100 | #33 | Exceptional 11.4% |
| Immigrants | Ethiopia | 100.0 /100 | #34 | Exceptional 11.4% |