Korean vs Cuban Single Male Poverty
COMPARE
Korean
Cuban
Single Male Poverty
Single Male Poverty Comparison
Koreans
Cubans
11.0%
SINGLE MALE POVERTY
100.0/ 100
METRIC RATING
15th/ 347
METRIC RANK
12.6%
SINGLE MALE POVERTY
79.9/ 100
METRIC RATING
139th/ 347
METRIC RANK
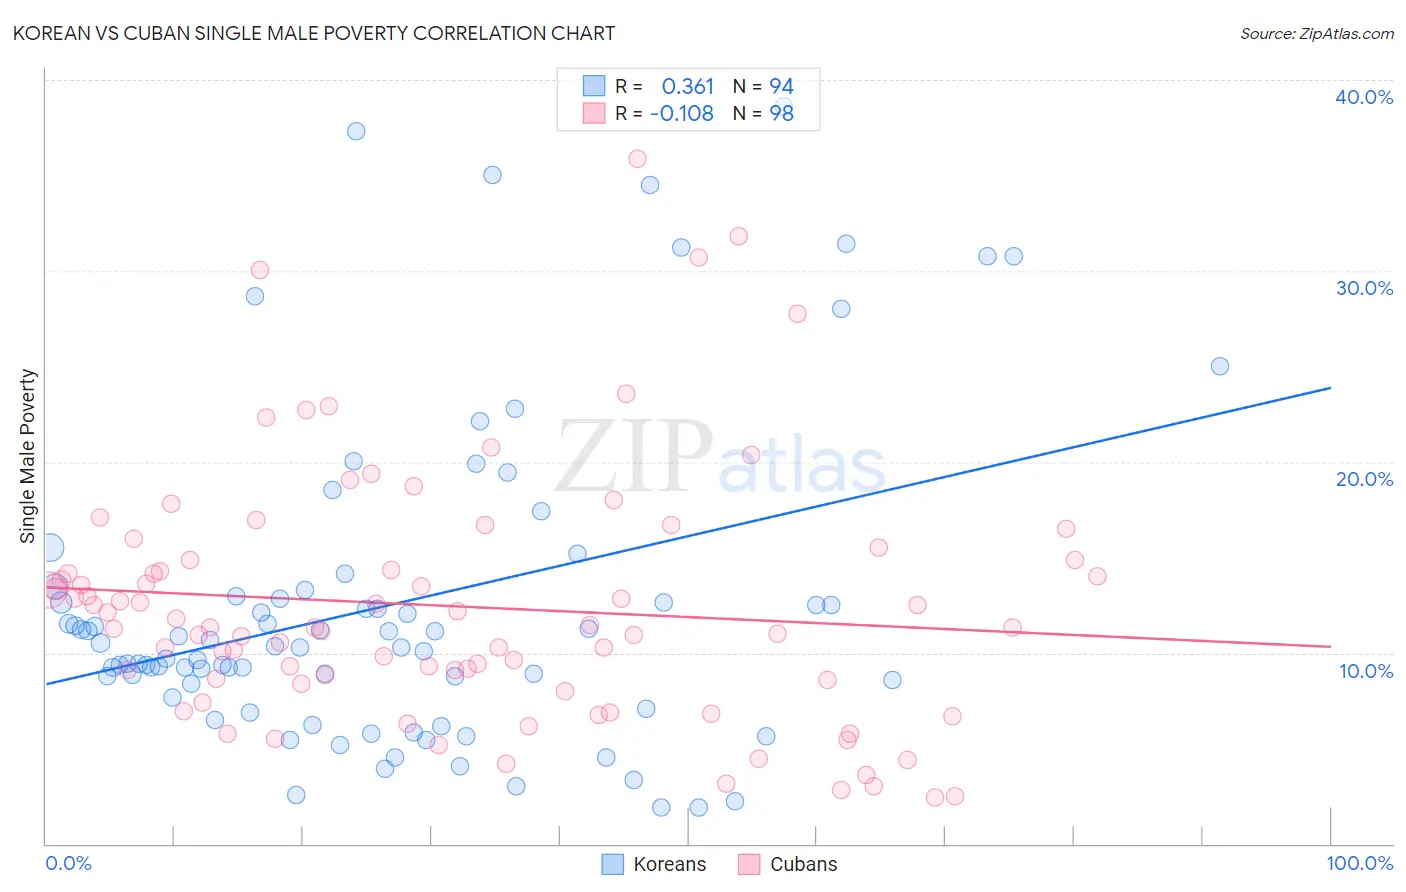
Korean vs Cuban Single Male Poverty Correlation Chart
The statistical analysis conducted on geographies consisting of 437,940,785 people shows a mild positive correlation between the proportion of Koreans and poverty level among single males in the United States with a correlation coefficient (R) of 0.361 and weighted average of 11.0%. Similarly, the statistical analysis conducted on geographies consisting of 395,594,477 people shows a poor negative correlation between the proportion of Cubans and poverty level among single males in the United States with a correlation coefficient (R) of -0.108 and weighted average of 12.6%, a difference of 14.3%.
Single Male Poverty Correlation Summary
| Measurement | Korean | Cuban |
| Minimum | 1.9% | 2.4% |
| Maximum | 38.6% | 35.9% |
| Range | 36.8% | 33.4% |
| Mean | 12.5% | 12.4% |
| Median | 10.3% | 11.4% |
| Interquartile 25% (IQ1) | 8.4% | 8.6% |
| Interquartile 75% (IQ3) | 13.0% | 14.8% |
| Interquartile Range (IQR) | 4.6% | 6.2% |
| Standard Deviation (Sample) | 8.3% | 6.5% |
| Standard Deviation (Population) | 8.3% | 6.5% |
Similar Demographics by Single Male Poverty
Demographics Similar to Koreans by Single Male Poverty
In terms of single male poverty, the demographic groups most similar to Koreans are Chinese (11.0%, a difference of 0.050%), Immigrants from South Central Asia (10.9%, a difference of 0.62%), Immigrants from Afghanistan (10.9%, a difference of 0.74%), Bhutanese (11.1%, a difference of 0.75%), and Immigrants from Philippines (10.9%, a difference of 0.82%).
| Demographics | Rating | Rank | Single Male Poverty |
| Thais | 100.0 /100 | #8 | Exceptional 10.8% |
| Taiwanese | 100.0 /100 | #9 | Exceptional 10.9% |
| Immigrants | Fiji | 100.0 /100 | #10 | Exceptional 10.9% |
| Immigrants | Philippines | 100.0 /100 | #11 | Exceptional 10.9% |
| Immigrants | Afghanistan | 100.0 /100 | #12 | Exceptional 10.9% |
| Immigrants | South Central Asia | 100.0 /100 | #13 | Exceptional 10.9% |
| Chinese | 100.0 /100 | #14 | Exceptional 11.0% |
| Koreans | 100.0 /100 | #15 | Exceptional 11.0% |
| Bhutanese | 100.0 /100 | #16 | Exceptional 11.1% |
| Tsimshian | 100.0 /100 | #17 | Exceptional 11.1% |
| Immigrants | Bolivia | 100.0 /100 | #18 | Exceptional 11.1% |
| Immigrants | Moldova | 100.0 /100 | #19 | Exceptional 11.2% |
| Ethiopians | 100.0 /100 | #20 | Exceptional 11.2% |
| Asians | 100.0 /100 | #21 | Exceptional 11.2% |
| Immigrants | Pakistan | 100.0 /100 | #22 | Exceptional 11.2% |
Demographics Similar to Cubans by Single Male Poverty
In terms of single male poverty, the demographic groups most similar to Cubans are Immigrants from El Salvador (12.6%, a difference of 0.010%), Ukrainian (12.6%, a difference of 0.070%), Immigrants from Zimbabwe (12.6%, a difference of 0.15%), Immigrants from Costa Rica (12.5%, a difference of 0.18%), and Immigrants from Austria (12.5%, a difference of 0.18%).
| Demographics | Rating | Rank | Single Male Poverty |
| Salvadorans | 83.7 /100 | #132 | Excellent 12.5% |
| Immigrants | Western Asia | 83.4 /100 | #133 | Excellent 12.5% |
| Immigrants | Ecuador | 82.1 /100 | #134 | Excellent 12.5% |
| Immigrants | Costa Rica | 81.9 /100 | #135 | Excellent 12.5% |
| Immigrants | Austria | 81.9 /100 | #136 | Excellent 12.5% |
| Ukrainians | 80.7 /100 | #137 | Excellent 12.6% |
| Immigrants | El Salvador | 80.0 /100 | #138 | Excellent 12.6% |
| Cubans | 79.9 /100 | #139 | Good 12.6% |
| Immigrants | Zimbabwe | 78.0 /100 | #140 | Good 12.6% |
| Okinawans | 75.9 /100 | #141 | Good 12.6% |
| Immigrants | Uganda | 75.9 /100 | #142 | Good 12.6% |
| Immigrants | France | 75.8 /100 | #143 | Good 12.6% |
| Hawaiians | 75.1 /100 | #144 | Good 12.6% |
| Immigrants | Lebanon | 75.0 /100 | #145 | Good 12.6% |
| Native Hawaiians | 75.0 /100 | #146 | Good 12.6% |