Arapaho vs Trinidadian and Tobagonian Single Male Poverty
COMPARE
Arapaho
Trinidadian and Tobagonian
Single Male Poverty
Single Male Poverty Comparison
Arapaho
Trinidadians and Tobagonians
21.9%
SINGLE MALE POVERTY
0.0/ 100
METRIC RATING
339th/ 347
METRIC RANK
13.0%
SINGLE MALE POVERTY
21.4/ 100
METRIC RATING
201st/ 347
METRIC RANK
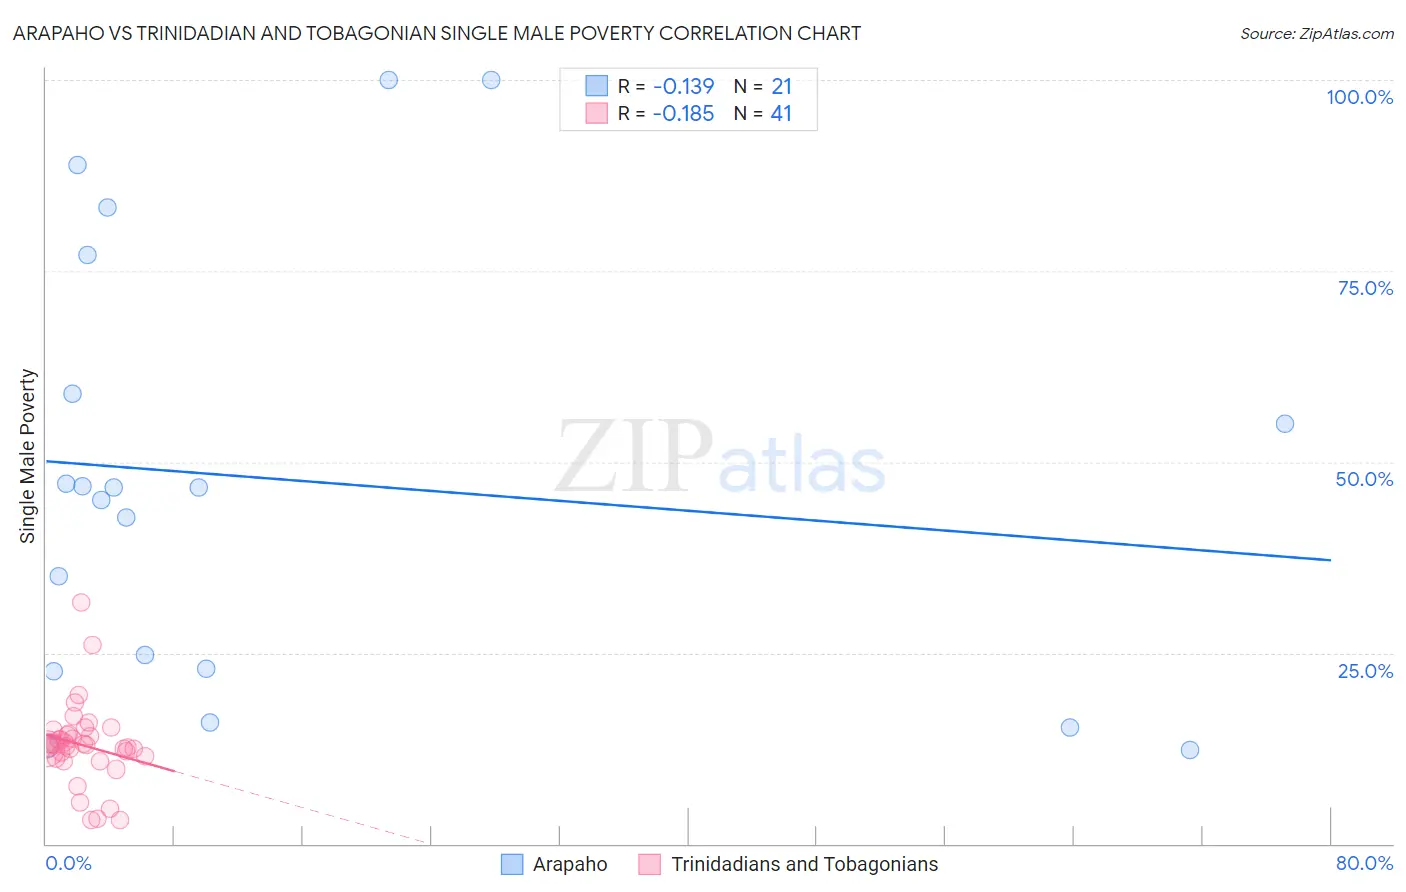
Arapaho vs Trinidadian and Tobagonian Single Male Poverty Correlation Chart
The statistical analysis conducted on geographies consisting of 29,002,421 people shows a poor negative correlation between the proportion of Arapaho and poverty level among single males in the United States with a correlation coefficient (R) of -0.139 and weighted average of 21.9%. Similarly, the statistical analysis conducted on geographies consisting of 204,213,293 people shows a poor negative correlation between the proportion of Trinidadians and Tobagonians and poverty level among single males in the United States with a correlation coefficient (R) of -0.185 and weighted average of 13.0%, a difference of 68.5%.
Single Male Poverty Correlation Summary
| Measurement | Arapaho | Trinidadian and Tobagonian |
| Minimum | 12.3% | 3.0% |
| Maximum | 100.0% | 31.6% |
| Range | 87.7% | 28.6% |
| Mean | 47.6% | 12.9% |
| Median | 46.6% | 13.0% |
| Interquartile 25% (IQ1) | 22.7% | 11.3% |
| Interquartile 75% (IQ3) | 68.0% | 14.4% |
| Interquartile Range (IQR) | 45.3% | 3.1% |
| Standard Deviation (Sample) | 28.3% | 5.3% |
| Standard Deviation (Population) | 27.6% | 5.2% |
Similar Demographics by Single Male Poverty
Demographics Similar to Arapaho by Single Male Poverty
In terms of single male poverty, the demographic groups most similar to Arapaho are Sioux (22.2%, a difference of 1.3%), Pueblo (21.6%, a difference of 1.5%), Apache (21.6%, a difference of 1.7%), Tohono O'odham (21.6%, a difference of 1.8%), and Yuman (21.3%, a difference of 3.0%).
| Demographics | Rating | Rank | Single Male Poverty |
| Natives/Alaskans | 0.0 /100 | #332 | Tragic 19.6% |
| Inupiat | 0.0 /100 | #333 | Tragic 20.0% |
| Pima | 0.0 /100 | #334 | Tragic 20.2% |
| Yuman | 0.0 /100 | #335 | Tragic 21.3% |
| Tohono O'odham | 0.0 /100 | #336 | Tragic 21.6% |
| Apache | 0.0 /100 | #337 | Tragic 21.6% |
| Pueblo | 0.0 /100 | #338 | Tragic 21.6% |
| Arapaho | 0.0 /100 | #339 | Tragic 21.9% |
| Sioux | 0.0 /100 | #340 | Tragic 22.2% |
| Crow | 0.0 /100 | #341 | Tragic 23.3% |
| Houma | 0.0 /100 | #342 | Tragic 23.5% |
| Puerto Ricans | 0.0 /100 | #343 | Tragic 25.1% |
| Lumbee | 0.0 /100 | #344 | Tragic 25.2% |
| Navajo | 0.0 /100 | #345 | Tragic 25.3% |
| Hopi | 0.0 /100 | #346 | Tragic 27.5% |
Demographics Similar to Trinidadians and Tobagonians by Single Male Poverty
In terms of single male poverty, the demographic groups most similar to Trinidadians and Tobagonians are Slovene (13.0%, a difference of 0.010%), Immigrants from Norway (13.0%, a difference of 0.030%), Lithuanian (13.0%, a difference of 0.050%), Basque (13.0%, a difference of 0.060%), and Immigrants from Bangladesh (13.0%, a difference of 0.090%).
| Demographics | Rating | Rank | Single Male Poverty |
| Liberians | 25.2 /100 | #194 | Fair 13.0% |
| Immigrants | England | 23.4 /100 | #195 | Fair 13.0% |
| Immigrants | Grenada | 23.1 /100 | #196 | Fair 13.0% |
| Immigrants | Laos | 23.1 /100 | #197 | Fair 13.0% |
| Lithuanians | 22.1 /100 | #198 | Fair 13.0% |
| Immigrants | Norway | 21.8 /100 | #199 | Fair 13.0% |
| Slovenes | 21.6 /100 | #200 | Fair 13.0% |
| Trinidadians and Tobagonians | 21.4 /100 | #201 | Fair 13.0% |
| Basques | 20.7 /100 | #202 | Fair 13.0% |
| Immigrants | Bangladesh | 20.4 /100 | #203 | Fair 13.0% |
| Estonians | 20.3 /100 | #204 | Fair 13.0% |
| Poles | 19.3 /100 | #205 | Poor 13.0% |
| Northern Europeans | 18.9 /100 | #206 | Poor 13.0% |
| Sudanese | 17.7 /100 | #207 | Poor 13.1% |
| Immigrants | Western Africa | 17.6 /100 | #208 | Poor 13.1% |