Korean vs Immigrants from Fiji Single Male Poverty
COMPARE
Korean
Immigrants from Fiji
Single Male Poverty
Single Male Poverty Comparison
Koreans
Immigrants from Fiji
11.0%
SINGLE MALE POVERTY
100.0/ 100
METRIC RATING
15th/ 347
METRIC RANK
10.9%
SINGLE MALE POVERTY
100.0/ 100
METRIC RATING
10th/ 347
METRIC RANK
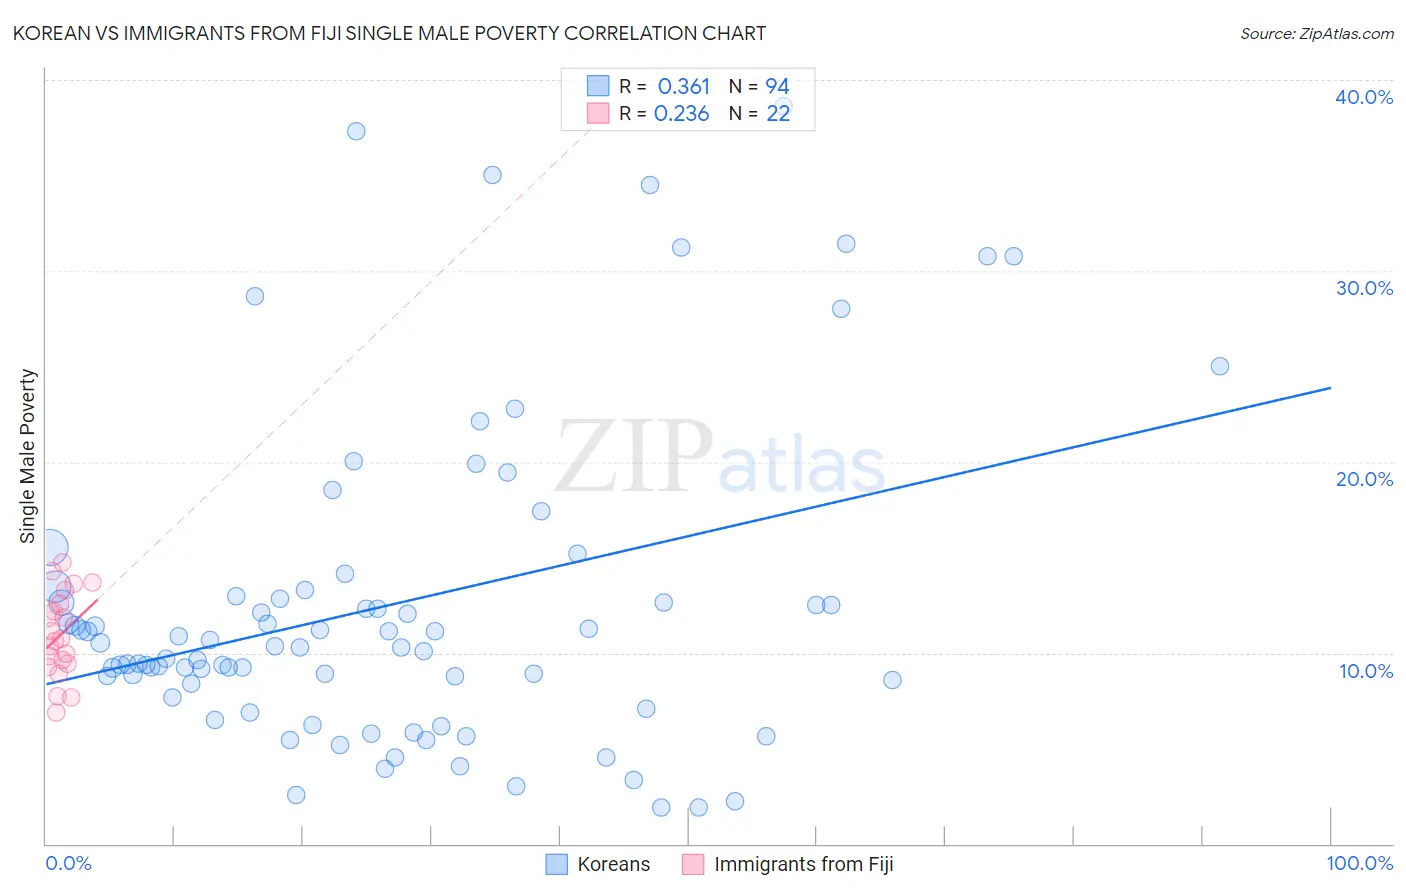
Korean vs Immigrants from Fiji Single Male Poverty Correlation Chart
The statistical analysis conducted on geographies consisting of 437,940,785 people shows a mild positive correlation between the proportion of Koreans and poverty level among single males in the United States with a correlation coefficient (R) of 0.361 and weighted average of 11.0%. Similarly, the statistical analysis conducted on geographies consisting of 90,653,076 people shows a weak positive correlation between the proportion of Immigrants from Fiji and poverty level among single males in the United States with a correlation coefficient (R) of 0.236 and weighted average of 10.9%, a difference of 0.84%.
Single Male Poverty Correlation Summary
| Measurement | Korean | Immigrants from Fiji |
| Minimum | 1.9% | 6.8% |
| Maximum | 38.6% | 14.7% |
| Range | 36.8% | 7.9% |
| Mean | 12.5% | 10.9% |
| Median | 10.3% | 10.7% |
| Interquartile 25% (IQ1) | 8.4% | 9.5% |
| Interquartile 75% (IQ3) | 13.0% | 12.6% |
| Interquartile Range (IQR) | 4.6% | 3.1% |
| Standard Deviation (Sample) | 8.3% | 2.2% |
| Standard Deviation (Population) | 8.3% | 2.2% |
Demographics Similar to Koreans and Immigrants from Fiji by Single Male Poverty
In terms of single male poverty, the demographic groups most similar to Koreans are Chinese (11.0%, a difference of 0.050%), Immigrants from South Central Asia (10.9%, a difference of 0.62%), Immigrants from Afghanistan (10.9%, a difference of 0.74%), Bhutanese (11.1%, a difference of 0.75%), and Immigrants from Philippines (10.9%, a difference of 0.82%). Similarly, the demographic groups most similar to Immigrants from Fiji are Immigrants from Philippines (10.9%, a difference of 0.020%), Taiwanese (10.9%, a difference of 0.050%), Immigrants from Afghanistan (10.9%, a difference of 0.090%), Immigrants from South Central Asia (10.9%, a difference of 0.22%), and Chinese (11.0%, a difference of 0.78%).
| Demographics | Rating | Rank | Single Male Poverty |
| Immigrants | Taiwan | 100.0 /100 | #2 | Exceptional 10.3% |
| Immigrants | India | 100.0 /100 | #3 | Exceptional 10.3% |
| Immigrants | Hong Kong | 100.0 /100 | #4 | Exceptional 10.4% |
| Tongans | 100.0 /100 | #5 | Exceptional 10.5% |
| Filipinos | 100.0 /100 | #6 | Exceptional 10.6% |
| Afghans | 100.0 /100 | #7 | Exceptional 10.7% |
| Thais | 100.0 /100 | #8 | Exceptional 10.8% |
| Taiwanese | 100.0 /100 | #9 | Exceptional 10.9% |
| Immigrants | Fiji | 100.0 /100 | #10 | Exceptional 10.9% |
| Immigrants | Philippines | 100.0 /100 | #11 | Exceptional 10.9% |
| Immigrants | Afghanistan | 100.0 /100 | #12 | Exceptional 10.9% |
| Immigrants | South Central Asia | 100.0 /100 | #13 | Exceptional 10.9% |
| Chinese | 100.0 /100 | #14 | Exceptional 11.0% |
| Koreans | 100.0 /100 | #15 | Exceptional 11.0% |
| Bhutanese | 100.0 /100 | #16 | Exceptional 11.1% |
| Tsimshian | 100.0 /100 | #17 | Exceptional 11.1% |
| Immigrants | Bolivia | 100.0 /100 | #18 | Exceptional 11.1% |
| Immigrants | Moldova | 100.0 /100 | #19 | Exceptional 11.2% |
| Ethiopians | 100.0 /100 | #20 | Exceptional 11.2% |
| Asians | 100.0 /100 | #21 | Exceptional 11.2% |
| Immigrants | Pakistan | 100.0 /100 | #22 | Exceptional 11.2% |